DEPARTMENT OF ENVIRONMENTAL MANAGEMENT
NOTICE OF COMMENT PERIOD
Office of Water Quality
Notice of Public Comment Period for the 2020 List of Impaired Waters
and Consolidated Assessment and Listing Methodology
under Section 303(d) of the Clean Water Act
Document #20-6
The Indiana Department of Environmental Management (IDEM) is soliciting public comment for the development of its draft 2020 303(d) List of Impaired Waters and the Consolidated Assessment and Listing Methodology (CALM) used to develop it. Any person having water quality data to support or refute the listing of a specific waterbody or to add a waterbody to the list will be able to provide that information to IDEM during the public comment period. Comments and suggestions regarding the CALM will also be accepted during this period. IDEM will review and respond to all comments received. IDEM will submit its finalized 2020 303(d) List of Impaired Waters as part of its 2020 Integrated Report to U.S. EPA by April 1, 2020. All public comments received during the public comment period and IDEM's responses will be included in its April 1, 2020, submittal to the United States Environmental Protection Agency (U.S. EPA).
Appendices 1 and 2 (IDEM's CALM and TMDL Priority Framework, respectively) are available in this notice. Appendices 3 through 11, which contain supporting tables, are provided on IDEM's website at: https://www.in.gov/idem/nps/2647.htm in a spreadsheet format to provide the public the ability to more effectively search for information regarding specific waters of interest. Anyone experiencing difficulty accessing these tables can obtain a copy by contacting Jody Arthur in the Watershed Assessment and Planning Branch, Office of Water Quality, (317) 308-3179 or (800) 451-6027 (in Indiana).
Basic Purpose and Background
The IDEM Office of Water Quality (OWQ) is preparing to update its 303(d) List of Impaired Waters, as required by Section 303(d) of the federal Clean Water Act (CWA) and the Water Quality Planning and Management regulation contained in the Code of Federal Regulations (CFR) at 40 CFR Part 130. Under the CWA, each state is required to assemble all existing and readily available water quality-related data and information for use in assessing its waters for compliance with the state's water quality standards (WQS). States may adopt national water quality criteria or develop state-specific criteria, or do both, to protect the uses described in their WQS. In Indiana, these uses include recreational uses, aquatic life use, and the use of some waters as a drinking water resource. States are required to prepare and make public a list of waters that do not meet the WQS and the methodology used to evaluate the data and determine impairment status. The 303(d) List of Impaired Waters will identify the following:
• The reach or reaches of the stream or river waterbody that is impaired or the lake that is impaired (lakes are evaluated as a single waterbody).
• The pollutant or pollutants that do not meet the WQS, thereby causing the impairment.
• A schedule for development of a Total Maximum Daily Load (TMDL).
A TMDL evaluation is a process that quantifies the amount of a specific pollutant that a waterbody can assimilate and still meet WQS. A description of what constitutes a pollutant is provided in Section 502(6) of the CWA and includes materials such as sewage, chemical wastes, biological materials, and wastes from industrial, municipal, and agricultural operations. The definition also encompasses drinking water contaminants that are regulated under Section 1412 of the Safe Drinking Water Act (SDWA). A TMDL is a written, quantitative assessment that accomplishes the following:
• Identifies how much of the pollutant is coming from point sources and nonpoint sources.
• Specifies the amount of pollutant reduction necessary from each source in order to meet the WQS set for that pollutant.
• Lays the groundwork for developing and implementing a plan to reduce the amount of the pollutant coming from each source.
As part of IDEM's TMDL process, the public is invited to participate in the plan to develop and implement the TMDL.
Status of U.S. EPA Approval of Indiana's 303(d) List of Impaired Waters
On May 9, 2019, U.S. EPA notified IDEM that it had consolidated its review of Indiana's 2012, 2014, 2016, and 2018 303(d) lists. In its approval letter, U.S. EPA concluded that IDEM has met the requirements of Section 303(d) of the federal CWA and all applicable requirements in the CFR for all waters submitted on its 303(d) lists to date. However, U.S. EPA has deferred action on certain waters with regard to metals issues that U.S. EPA and IDEM have yet to resolve.
IDEM develops its 303(d) List of Impaired Waters pursuant to Section 303(d) of the federal CWA. This notice serves as a solicitation for any additional water quality-related information that may be used to further develop and refine the 2020 303(d) list and satisfies the federal Water Quality Planning and Management regulation in 40 CFR Part 130.
REQUEST FOR PUBLIC COMMENTS
At this time, IDEM solicits the following:
(1) Water quality data or water quality-related information to support or refute the listing of a specific waterbody or to add a waterbody to the 303(d) list.
(2) Comments and suggestions regarding the CALM.
Comments may be submitted in one of the following ways:
(1) By mail or common carrier to the following address:
Document #20-6 2020 Draft 303(d) List of Impaired Waters
Karla Kindrick, Administrative Assistant
Rules Development Branch
Office of Legal Counsel
Indiana Department of Environmental Management
Indiana Government Center North
100 North Senate Avenue
Indianapolis, IN 46204-2251
(2) By facsimile to (317) 233-5970. Please confirm the timely receipt of your faxed comments by calling the Rules Development Branch at (317) 232-8922.
(3) By electronic mail to kkindric@idem.in.gov. To confirm timely delivery of your comments, please request a document receipt when you send the electronic mail. PLEASE NOTE: Electronic mail comments will NOT be considered part of the official written comment period unless they are sent to the address indicated in this notice.
(4) Hand delivered to the receptionist on duty at the thirteenth floor reception desk, Office of Legal Counsel, Indiana Government Center North, 100 North Senate Avenue, Indianapolis, Indiana.
Regardless of the delivery method used, each comment document must clearly specify the document number at the top of this notice so that IDEM can properly associate your comment with the action it is intended to address.
All comments must be postmarked, faxed, or time stamped not later than April 28, 2020. Hand-delivered comments must be delivered to the appropriate office by 4:45 p.m. on the above-listed deadline date.
Additional information regarding this notice may be obtained from Jody Arthur in the Watershed Assessment and Planning Branch, Office of Water Quality, (317) 308-3179 or (800) 451-6027 (in Indiana).
DEVELOPMENT OF INDIANA'S 2020 303(D) LIST OF IMPAIRED WATERS
For the development of the 2020 Draft 303(d) List of Impaired Waters, IDEM has followed, to the degree possible, the 305(b) and 303(d) reporting methods outlined in U.S. EPA "Guidance for 2004 Assessment, Listing and Reporting Requirements Pursuant to Sections 303(d), 305(b) and 314 of the Clean Water Act" (U.S. EPA, 2003) and the additional guidance provided in U.S. EPA memorandums containing information concerning CWA Sections 303(d), 305(b), and 314 integrated reporting and listing decisions for the 2006, 2008, 2010, 2012, 2014, 2016, and 2018 cycles (U.S. EPA, 2005-2017).
For the 2018 cycle, U.S. EPA issued a memorandum focusing primarily on the transition of state water quality assessment reporting systems, including Indiana's Assessment Database (ADB) to the new, federal Assessment and Total Maximum Daily Load Tracking and Implementation System (ATTAINS) online (U.S. EPA, 2017). U.S. EPA's goal for this transition is to more effectively analyze and share state water quality assessment information across its water programs and to measure progress toward its Strategic Plan.
Indiana formally submitted its finalized 2018 303(d) list to U.S. EPA via ATTAINS on June 18, 2019. The draft 2020 303(d) list contained in this notice was developed with the water quality assessment data now in ATTAINS. IDEM's interpretation of the data and listing decisions take into account U.S. EPA's guidance and IDEM's current CALM. This notice identifies all changes to the 303(d) list that have been made since U.S. EPA's May 9, 2019, approval of Indiana's 2012-2018 303(d) lists.
Indiana's Consolidated List
One aspect of U.S. EPA's guidance calls for a comprehensive listing of all monitored or assessed waterbodies in the state based on the state's assessment and listing methodology. Each waterbody assessment unit (AU), which may consist of an entire waterbody or a segment of a larger waterbody, is to be placed in one or more of five categories depending on the degree to which it supports designated uses. U.S. EPA guidance encourages states to place a waterbody AU in additional categories as appropriate in order to more clearly illustrate where progress has been made in TMDL development and other restoration efforts. Therefore, waterbodies are assigned to one category for each of the following designated uses: aquatic life use, recreational use, fish consumption1, and public water supply2.
A detailed explanation of the five categories is provided in IDEM's CALM in Appendix 1. The following is a summary of the five categories:
| | |
| Category 1 | The available data or information, or both, indicate that all designated uses are supported and no use is threatened. |
| Category 2 | The available data or information, or both, indicate the individual designated use is supported. |
| Category 3 | The available data or other information is insufficient to determine if the individual designated use is supported. |
| Category 4 | The available data or information, or both, indicate that the individual designated use is impaired or threatened but a TMDL is not required due to one or more of the following reasons: |
| | A. | A TMDL for one or more pollutants has been completed and approved by U.S. EPA and is expected to result in attainment of all applicable WQS. |
| | B. | Other pollution control requirements are reasonably expected to result in the attainment of all WQS applicable to the pollutant or pollutants in a reasonable period of time. |
| | C. | The impairment is not caused by a pollutant and, as such, does not require a TMDL. |
| Category 5 | The available data or information, or both, indicate the individual designated use is impaired or threatened, and a TMDL is required due to one or both of the following reasons: |
| | A. | The individual designated use is impaired or threatened by one or more pollutants and requires a TMDL. |
| | B. | The waterbody is impaired due to the presence of mercury or PCBs, or both, in the edible tissue of fish at concentrations exceeding Indiana's human health criteria for these contaminants. |
The 303(d) List of Impaired Waters consists of all impairments listed in Category 5. This category includes waters where the WQS is not attained because the waterbody AU is impaired or threatened by one or more pollutant(s) for each of which a TMDL is required. However, due to the complex nature of the contaminants involved, IDEM categorizes all fish tissue-related impairments into Category 5B (a state-defined subcategory similar to U.S. EPA's 5M subcategory) deferring development of a conventional TMDL to allow other contaminant clean-up efforts to remedy such impairments.
U.S. EPA Rules for Delisting Impairments
U.S. EPA's most recent guidance does not change existing rules for listing and delisting impairments from Category 5. The existing regulations still require states, at the request of the U.S. EPA's Regional Administrator, to demonstrate good cause for not including impairments on the 303(d) list that were included on previous 303(d) lists (pursuant to 40 CFR 130.7(b)(6)(iv)). In general, IDEM will consider delisting an impairment only if one of the following is true:
• New data indicate that WQS are now being met for the specific cause of impairment to the AU under consideration.
• The assessment or listing methodology, or both, has changed, and the AU would not be considered impaired in accordance with the new methodology.
• An error is discovered in the sampling, testing, or reporting of data that led to an inappropriate listing.
• IDEM determines that another program other than the TMDL program is better suited to address the water quality problem.
• IDEM determines that the water quality problem is not caused by a pollutant for which a TMDL can be developed.
• A TMDL has been approved by U.S. EPA for the impairment.
IDEM'S Methods for Prioritizing TMDL Development
The CWA does not clearly define the timeline for TMDL development. However, IDEM works with U.S. EPA Region 5 every 303(d) listing cycle to determine IDEM's short term TMDL schedule, which identifies the TMDLs to be developed for the next cycle. For the 2020 cycle, IDEM's TMDL development has been focused on two watersheds:
• Lower Salt Creek Watershed Salt Creek – TMDL approved on September 10, 2018.
• Lower East Fork White River Watershed – TMDL currently under development.
• IDEM will submit its finalized list of TMDLs developed for the 2020 cycle with the submittal of its 2020 Integrated Report.
IDEM's long term schedule for TMDL development was developed in accordance with the methods described in IDEM's TMDL Program Priority Framework (Appendix 2). This framework was developed in 2015 and describes IDEM's methods for prioritizing waters for TMDL planning and watershed restoration. It also includes the agency's long term TMDL development schedule, which identifies the watersheds in which TMDLs will be developed through the 2022 cycle. More detailed information on IDEM's 303(d) TMDL Program Priority Framework and the long term schedule for TMDL development can be found in IDEM's CALM (Appendix 1).
As with IDEM's short term schedule, the watersheds identified on IDEM's long term schedule may change based on unanticipated circumstances. While the specific watersheds IDEM focuses on may change, IDEM will prioritize TMDL development using the methods described in its Program Priority Framework to help ensure consistency with U.S. EPA's long term vision.
How Impairment Information Is Organized on Indiana's 303(d) List of Impaired Waters
IDEM now maintains assessment information for all Indiana waters in ATTAINS for CWA 305(b) reporting and 303(d) listing purposes and to provide assessment information when requested by the public. Every lake, stream, or reach of stream in ATTAINS is assigned a unique assessment unit identification (AUID).
Generally, each lake or reservoir is considered one AU and is assigned a single AUID. For flowing waters, the sizes of AUs vary based on a number of factors such that a single AUID may represent an entire stream or only one reach of it. IDEM's methods for defining representative AUs are discussed in detail in the CALM.
On the 303(d) list, impairments are listed individually in order to achieve consistency with the way U.S. EPA tracks TMDL development and to facilitate more effective planning by IDEM. Therefore, a single AU may appear on the 303(d) list for one or more impairments.
Revisions to Indiana's Reach Index for Mapping Impairments
IDEM defines the geographical extent and location of each AU within a given 12 or 14 digit hydrologic unit code (HUC) for mapping purposes through a process called reach indexing. Reach indexing uses software tools that work within geographical information systems (GIS) applications to delineate one or more AUs for a given waterbody and to "key" these AUs to the National Hydrography Dataset (NHD)3, which allows them to be mapped. This "key" is the Reach Index, which facilitates mapping of Indiana's 305(b) assessments and 303(d) listings in GIS applications and incorporating this information into IDEM's ADB and U.S. EPA's national databases.
IDEM developed its original Reach Index using the NHD at medium resolution (1:100,000 scale). When the NHD became available for Indiana in high resolution (1:24,000 scale), IDEM found that a significantly greater number of first and second order streams4 appeared at this scale than were visible in its original Reach Index. These small streams and stream networks are an important component of the hydrology in their watersheds and can have significant effects on water quality in larger streams.
In order to provide a more comprehensive picture of water quality conditions throughout Indiana, IDEM worked to revise its Reach Index over the course of several integrated reporting cycles to incorporate the high resolution NHD. IDEM finalized its High Resolution (HR) Reach Index in 2017. While IDEM may in the future make additional changes, any revisions of IDEM's HR Reach Index will be limited and conducted only when needed to support National Pollutant Discharge Elimination System (NPDES) permit development, such as the application of site-specific criteria, or to support other IDEM OWQ program needs.
Changes in the Reach Index can trigger changes in the 303(d) list. In keeping with U.S. EPA policy, as reaches were re-indexed, any impairments identified for the original reach were applied to all new reaches resulting from re-indexing. However, the original assessment information may or may not be representative of every one of the new reaches to which it was applied. Given this, IDEM continues to evaluate the original assessment information for any AUID re-indexed to ensure its proper application to newly indexed AUs and expects to make changes to its 303(d) list in future reporting cycles.
IDEM will provide a full record of all segmentation changes to date to U.S. EPA with its submittal of its 2020 Integrated Report to facilitate the tracking of information pertaining to the 303(d) list and TMDL development. Changes to the 303(d) list based on re-indexing are identified for the 2020 cycle in Appendices 8 and 9.
HOW IDEM DEVELOPED THE DRAFT 2020 303(D) LIST
Each 303(d) list builds upon the previous list. To develop the draft 2020 303(d) list in this notice, IDEM used as its basis the approved 2018 303(d) list. The tables in this notice identify all impairments removed from and added to Category 5 as well as those added to Category 4A based on the approval of TMDLs developed for them. Tables summarizing all changes made to date for the 2020 cycle are also provided in this notice.
IDEM's Consolidated Assessment and Listing Methodology
The impairments on Indiana's draft 303(d) list were identified through IDEM's CWA Section 305(b) water quality assessment process. Water quality assessments are made for each designated use and waterbody type by comparing the available data with the applicable WQS following the methods described in IDEM's Consolidated Assessment and Listing Methodology (CALM), which is provided in Appendix 1.
IDEM's CALM can change from cycle to cycle for one or more of the following reasons:
• New science or other information becomes available to support the development of new assessment methods or revisions to existing methods.
• Changes in Indiana's water quality standards, such as the adoption of new water quality criteria, make a change in the applicable assessment methodology necessary.
• IDEM identifies a change that will result in more accurate or representative water quality assessments.
For the 2020 cycle, IDEM added a new parameter, percent oxygen saturation, to the suite of parameters the agency uses to assess the degree to which nutrient enrichment may be impacting water quality in a given stream. The original suite of parameters included two values for dissolved oxygen, 4.0 mg/l and 12 mg/l, which together represented the range of expected values for a nonimpacted stream. Values outside of these benchmarks were considered representative of high diurnal swings in oxygen concentrations, which is a common indicator of excess nutrient enrichment in streams.
When IDEM reevaluated the data for nutrient impairments based in part on dissolved oxygen results, it was found that most of the dissolved oxygen values exceeding 12 mg/l were collected in winter months. In colder months, higher dissolved oxygen values would be expected due to the inverse relationship between water temperature and dissolved oxygen.
The ability of cold water to "hold" more dissolved oxygen than warm water makes the time of year in which a sample is collected an important factor to consider when evaluating the nutrient condition of a stream. Dissolved oxygen values greater than 12 mg/l in samples collected during winter may be driven more by temperature than any increase in the photosynthesis of excess algae resulting from nutrient enrichment. For this reason, IDEM has determined that using the percent saturation of dissolved oxygen is a better indicator of photosynthetic activity than a single value for dissolved oxygen concentration and, thus, more representative of nutrient enrichment.
When evaluating dissolved oxygen to determine if nutrient enrichment is impacting a given stream, IDEM now uses a percent saturation value for dissolved oxygen instead of its concentration value. To determine the appropriate value to use, IDEM reviewed several years' worth of data collected from IDEM's fixed station sites, which are sampled year round. This analysis revealed values above 120 percent dissolved oxygen saturation were strongly correlated with exceedances of other nutrient benchmarks. Based on this, IDEM considers dissolved oxygen results exceeding 120 percent saturation, when combined with exceedances of one or more other nutrient benchmarks in the CALM, representative of nutrient impairment.
IDEM's Use of External Data
Most of the data used in IDEM's CWA Section 305(b) water quality assessments comes from IDEM's water monitoring programs. However, Section 303(d) of the CWA requires that states consider all readily available data sources in the preparation of their 303(d) lists. On September 23, 2015, IDEM launched its External Data Framework (EDF) to provide a systematic, transparent, and voluntary means for external organizations to share the water quality data they collect with IDEM for potential use in its CWA assessment and listing processes.
IDEM has received data sets from the Army Corps of Engineers and the Marion County Health Department through the EDF and is currently evaluating them for potential use in IDEM's water quality assessments and 303(d) listing processes.
To utilize external data for 303(d) listing, the data must satisfy certain quality requirements. Therefore, IDEM is also working to develop an online tool to assist EDF participants (and anyone else collecting water quality monitoring data) to better document the quality of the data they collect. The Online Quality Assurance Project Plan (QAPP) Tool will allow users to fill out a preformatted QAPP template that includes all the necessary elements that the organization collecting the data or any secondary users of the data set (including IDEM) would need to determine whether it is reliable for their needs. The tool will allow users to develop their QAPPs over as many sessions as they need, will provide an extensive library of documents to help the user understand the information needed in different sections of the QAPP, and will allow users to e-mail IDEM staff directly with any QAPP-related questions they may have.
While the QAPP tool will be available to any organization conducting water quality monitoring, IDEM is developing it primarily for use by EDF participants to help them provide sufficient quality assurance documentation with their data submittals. IDEM expects to complete development of the QAPP tool by late 2020.
The public is invited to explore IDEM's EDF website and its Secondary Data Portal to learn more about the EDF and how to submit water quality data for potential use in the development of IDEM's 303(d) list for future cycles:
• IDEM Office of Water Quality's EDF website: http://in.gov/idem/cleanwater/2485.htm
• IDEM Office of Water Quality's Secondary Data Portal: http://www.hoosierriverwatch.com/portal/
The public is also encouraged to use this comment period as an opportunity to provide feedback to IDEM regarding the EDF. All comments received during the public comment period for the 2020 303(d) list will be reviewed and evaluated to identify potential improvements to the process or to suggest any changes in IDEM's policies regarding the use of external data in its decision making processes.
Impairments Removed from Category 5A as a Result of TMDL Development
For the 2020 cycle, IDEM submitted a TMDL report for the Lower Salt Creek Watershed in south central Indiana, which was approved by U.S. EPA on September 10, 2018. IDEM moved forty-two (42) impairments previously listed in Category 5 to Category 4A based on this TMDL report. IDEM also has done a thorough review of its Category 4A waters as a part of its transition to the ATTAINS database and has moved an additional sixteen (16) impairments associated with previously approved TMDLs from Category 5 to Category 4A.
To facilitate public review of the resulting changes to the 303(d) list, all impairments moved into Category 4A for the 2020 cycle are identified in Appendix 3. The TMDL reports for approved TMDLs, along with information on their development, can be found online at: http://www.in.gov/idem/nps/2347.htm.
Impairments Removed from Category 5 Based on New or Revised Assessments Indicating that Applicable WQS Are Being Met
This section includes impairments removed from Category 5 based on more recent data or other information that have become available since U.S. EPA approval of IDEM's 2018 303(d) list, some through new assessments and others through review of existing assessment information. IDEM has identified a total of fifteen (15) previously identified impairments for which WQS are now being met (Appendix 4). These impairments have been removed from Category 5A for the 2020 cycle.
Impairments Added to Category 5 Based on New or Revised Assessments
This section includes impairments added to Category 5 based on more recent data or other information that have become available since IDEM's 2018 303(d) list was approved by U.S. EPA.
For a lake or stream to be listed, IDEM must have sampling data representative of that waterbody, and the data collected must support 303(d) listing in accordance with IDEM's CALM.
The impairments added to the 303(d) list based on new or revised assessments are located mostly in the Upper Illinois River basin, which was sampled by IDEM in 2017, and the Great Lakes sampled in 2018. Based on these assessments, IDEM has added a total of eighteen (18) impairments to Category 5 (Appendix 5).
Changes to Category 5 Based on IDEM's Ongoing Review to Identify Errors and Omissions and to Ensure Consistency with Indiana's WQS
IDEM routinely reviews its 303(d) list for errors and omissions, and to ensure consistency with Indiana's WQS and the information IDEM maintains in its ADB. For the 2020 cycle, IDEM has identified four (4) impairments that should be removed from Category 5 (Appendix 6) and a total of thirty-six (36) impairments that should be added (Appendix 7).
Impairments Removed from Category 5 Based on Changes to Indiana's High Resolution Reach Index
In keeping with U.S. EPA policy, no impairment may be delisted without good cause, which is described in this notice under the heading "Indiana's Consolidated List". Re-indexing alone does not constitute good cause for delisting. Although retiring an impaired AU requires delisting of its impairments, it is IDEM's policy to add those impairments back to the 303(d) under their new AUIDs unless IDEM can demonstrate good cause to do otherwise.
IDEM expects to make very few changes to the HR Reach Index in the future, and most of the changes resulting from IDEM's high resolution re-indexing effort have been reported in previous cycles. However, IDEM does expect to make additional changes to its 303(d) list in the future as IDEM works to evaluate the original assessment information associated with re-indexed AUs to ensure its proper application to newly indexed AUs. For the 2020 cycle, IDEM has removed a total of eighteen (18) impairments from Category 5 based on re-indexing (Appendix 8). Most of these impairments were already listed in Category 5 under their new AUIDs. However, three (3) impairments were not and were added back under their new AUs (Appendix 9).
Summary of Changes to Indiana's 303(d) List for the 2020 Cycle
Table 1 summarizes the proposed removals from and additions to Indiana's 303(d) list and the impact of these changes in terms of:
• The total number of impairments and the total number of individual waterbodies impaired. Note that these values differ because a single waterbody may be listed for one or more individual impairments.
• The total number of impairments and individual waterbodies impaired, broken out by waterbody type (streams versus lakes).
• The total number of stream miles and lake acres impaired.
Table 2 provides a comparison of the approved 2018 303(d) list and the draft 2020 303(d) list in terms of the types of changes made (removals and additions to Category 5).
Table 3 provides a simple comparison of the approved 2018 303(d) list and the draft 2020 list contained in this notice.
Table 4 provides a comparison of the different types of impairments identified on Indiana's 303(d) list, both for 2018 and now.
A Comprehensive Picture of Impairment to Indiana Waters
The 303(d) list is a subset of Indiana's Consolidated List, which provides a comprehensive accounting of all assessment information IDEM has for Indiana waters to date, including waters that have been found fully supporting of one or more designated uses (Categories 1 and 2), those that have yet to be assessed (Category 3), and waters that are impaired (Categories 4 and 5). The 303(d) list is comprised of Category 5 impairments only, which includes Category 5A (water column impairments) and Category 5B (fish tissue impairments).
While this notice pertains specifically to changes made to Category 5 impairments, it is important to note that in order to gain a fully comprehensive view of all impaired waters in Indiana, one must also consider Category 4 waters, which are impaired but do not require a TMDL for one of the following reasons:
• Category 4A – A TMDL for one or more pollutants has been completed and approved by U.S. EPA and is expected to result in attainment of all applicable WQS.
• Category 4B – Other pollution control requirements are reasonably expected to result in the attainment of all WQS applicable to the pollutant or pollutants in a reasonable period of time.
• Category 4C – The impairment is not caused by a pollutant and, as such, does not require a TMDL.
Indiana's draft 2020 303(d) list, which includes all Category 5 impairments, is provided in Appendix 10, and Appendix 11 identifies all Category 4 waters. Together, these appendices provide the most comprehensive assessment of impairment of Indiana waters to date.
With the combined changes made for the 2020 cycle, Indiana's draft 2020 303(d) List of Impaired Waters identifies a total of six thousand six hundred thirty-five (6,635) impairments that will require TMDLs (Figure 1).
To date, IDEM has completed a total of two thousand eight hundred sixty-two (2,862) TMDLs, which have been approved by U.S. EPA for impairments to Indiana waters (Figure 2). Appendix 12 provides a TMDL key that can be used to associate the Category 4A impairments identified in Appendix 11 with their associated TMDLs, which are available on IDEM's website at: https://www.in.gov/idem/nps/2652.htm.
Table 1: Changes to the approved 2018 303(d) List.
| | | | | | | | |
| Nature of Change | Total Number of Impairments | Total Number of Individual Waterbodies* | Stream Impairments | Individual Streams** | Stream Miles | Lake
Impairments | Individual Lakes*** | Lake Acres*** |
| Impairments Removed from Category 5 |
| Impairments moved from Category 5 to Category 4A based on TMDL development* | 58 | 58 | 58 | 58 | 261 | 0 | 0 | 0 |
| Impairments removed from Category 5 based on new or revised assessments | 15 | 13 | 15 | 13 | 87 | 0 | 0 | 0 |
| Impairments removed from Category 5 based on IDEM's ongoing review for errors and inconsistencies | 4 | 4 | 4 | 4 | 25 | 0 | 0 | 0 |
| Impairments removed from Category 5 based on re-indexing | 18 | 14 | 15 | 11 | 11 | 3 | 3 | 59 |
| Impairments Added to Category 5 |
| Impairments added to Category 5 based on new or revised assessments | 73 | 56 | 73 | 56 | 332 | 0 | 0 | 0 |
| Impairments added to Category 5 based on IDEM's ongoing review for errors and inconsistencies | 36 | 31 | 36 | 31 | 173 | 0 | 0 | 0 |
| Impairments added back to Category 5 based on re-indexing | 3 | 3 | 1 | 1 | 1 | 2 | 2 | 44 |
*The term "waterbodies" includes streams, stream reaches, and Great Lakes shoreline reaches, which are measured in miles and are included in the values shown for streams. Lakes are also considered waterbodies.
**The term "streams" refers to all streams, reaches of streams, and Great Lakes shoreline reaches defined by a unique Assessment Unit ID (AUID).
***For accurate year-to-year comparisons, this value does not include Lake Michigan, which is 154,176 acres in size.
Table 2: Changes to Indiana's 303(d) List of Impaired Waters in terms of the total number of impairments added to or removed from the approved 2018 303(d) list.
| |
| Total Number of Impairments on the 2018 approved 303(d) List | 6,618* |
| Impairments moved from Category 5 to Category 4A based on TMDL development | 58 |
| Impairments removed from Category 5 based on new or revised assessments | 15 |
| Impairments removed from Category 5 based on IDEM's ongoing review for errors and inconsistencies | 4 |
| Impairments removed from Category 5 based on re-indexing | 18 |
| DELISTINGS TOTAL | 95 |
| Impairments added to Category 5 based on new or revised assessments | 73 |
| Impairments added to Category 5 based on IDEM's ongoing review for errors and inconsistencies | 36 |
| Impairments added back to Category 5 based on re-indexing | 3 |
| ADDITIONS TOTAL | 112 |
| Total Number of Impairments on Draft 2020 303(d) List | 6,635 |
*Source: ATTAINS Report: 2018-EPA Interim Action (Snapshot).
Table 3: Comparison of the approved 2018 303(d) List of Impaired Waters and the draft 2020 303(d) List of Impaired Waters.
| | | | | | | | |
| 303(d) List | Total Number of Impairments | Total Number of Individual Waterbodies* | Stream Impairments | Individual Streams** | Stream Miles | Lake Impairments |
Individual Lakes *** | Lake Acres*** |
| Approved 2018 303(d) List | 6,618 | 4,361 | 6,445 | 4,224 | 21,002 | 173 | 137 | 56,398 |
| Draft 2020 303(d) List | 6,635 | 4,376 | 6,463 | 4,229 | 21,134 | 172 | 136 | 44,676 |
*The term "waterbodies" includes streams, stream reaches, and Great Lakes shoreline reaches, which are measured in miles and are included in the values shown for streams. Lakes are also considered waterbodies.
**The term "streams" refers to all streams, reaches of streams, and Great Lakes shoreline reaches defined by a unique Assessment Unit ID (AUID).
***For accurate year-to-year comparisons, this value does not include Lake Michigan, which is 154,176 acres in size.
Table 4: Comparison of the types of impairments shown on the approved 2018 303(d) List of Impaired Waters and the draft 2020 303(d) List of Impaired Waters.
| | |
| Cause of Impairment | Number of Impairments on the Approved 2018 303(d) List | Number of Impairments on the Draft 2020 303(d) List |
| E. COLI | 2,307 | 2,286 |
| BIOLOGICAL INTEGRITY | 1,524 | 1,555 |
| PCBs (FISH TISSUE) | 1,258 | 1,256 |
| DISSOLVED OXYGEN | 561 | 556 |
| NUTRIENTS | 435 | 449 |
| TOTAL MERCURY (FISH TISSUE) | 140 | 139 |
| DIOXIN (WATER) | 69 | 69 |
| PCBs (WATER) | 69 | 69 |
| TOTAL MERCURY (WATER) | 42 | 42 |
| PHOSPHORUS | 50 | 50 |
| PH | 38 | 41 |
| CHLORIDE | 50 | 50 |
| ALGAE | 12 | 12 |
| TASTE AND ODOR | 12 | 12 |
| AMMONIA | 23 | 23 |
| FREE CYANIDE | 6 | 4 |
| OIL AND GREASE | 5 | 5 |
| PESTICIDES | 3 | 3 |
| SEDIMENTATION/SILTATION | 1 | 1 |
| SULFATE | 8 | 8 |
| CADMIUM (DISSOLVED) | 1 | 1 |
| COPPER (DISSOLVED) | 1 | 1 |
| NICKEL (DISSOLVED) | 1 | 1 |
| ZINC (DISSOLVED) | 2 | 2 |
| Total | 6,618 | 6,634 |
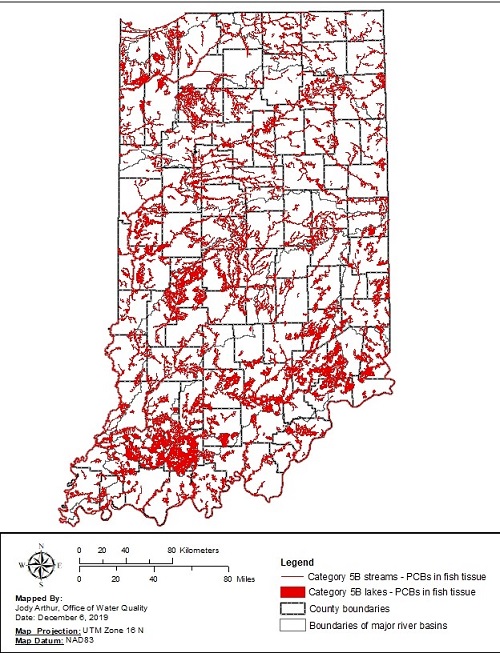
Figure 1: All Category 5 waters on Indiana's draft 2020 303(d) list.
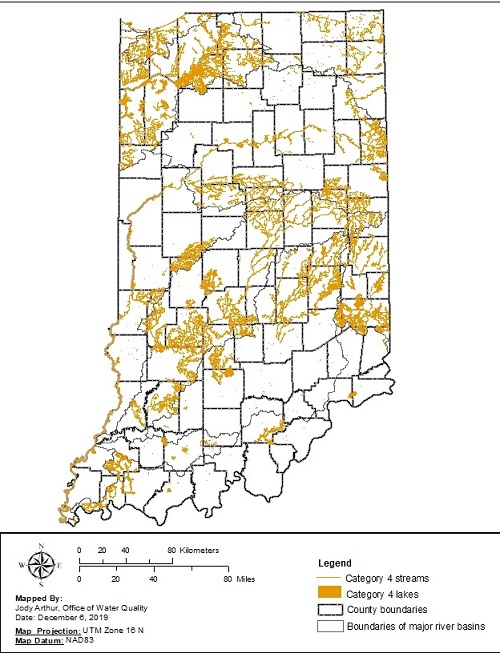
Figure 2: All impairments to date for which a TMDL has been approved (Category 4A waters).
All information used to create the maps in this report was obtained from IDEM databases and Geographical Information Systems Libraries, and the State of Indiana Geographical Information Office.
Indiana Administrative Code (IAC): http://iac.iga.in.gov/iac/title327.html
Indiana Department of Environmental Management (IDEM). 2004. Quality Assurance Project Plan for Indiana Surface Water Quality Monitoring and Total Maximum Daily Load (TMDL) Program. Office of Water Management, Assessment Branch, Environmental Toxicology and Chemistry Section. Indianapolis, IN.
Indiana Department of Environmental Management (IDEM). 2005. Indiana Water Quality Monitoring Strategy (draft). Office of Water Management, Assessment Branch. Indianapolis, IN. B-001-OWQ-A-00-06-0-R3.
U.S. Environmental Protection Agency. 2003. Guidance for 2004 Assessment, Listing and Reporting Requirements Pursuant to Sections 303(d) and 305(b) of the Clean Water Act, July 21, 2003; TMDL-01-03. Washington, D.C.: U.S. Environmental Protection Agency.
U.S. Environmental Protection Agency. 2005. Guidance for 2006 Assessment, Listing and Reporting Requirements Pursuant to Sections 303(d), 305(b) and 314 of the Clean Water Act, July 29, 2005. Washington, D.C.: U.S. Environmental Protection Agency.
U.S. Environmental Protection Agency. 2006. Information Concerning 2008 Clean Water Act Sections 303(d), 305(b), and 314 Integrated Reporting and Listing Decisions. Washington, D.C.: U.S. Environmental Protection Agency.
U.S. Environmental Protection Agency. 2009. Information Concerning 2010 Clean Water Act Sections 303(d), 305(b), and 314 Integrated Reporting and Listing Decisions. Washington, D.C.: U.S. Environmental Protection Agency.
U.S. Environmental Protection Agency. 2011. Information Concerning 2012 Clean Water Act Sections 303(d), 305(b), and 314 Integrated Reporting and Listing Decisions. March 21, 2011 Memorandum from U.S. EPA Office of Wetlands, Oceans and Watershed to U.S. EPA Regional Water Division Directors and Directors in U.S. EPA's Region 1 Office of Environmental Measurement and Evaluation, Region 2 Division of Environmental Science and Assessment, Region 7 Environmental Sciences Division, and Region 10 Office of Environmental Assessment. Washington, D.C.: U.S. Environmental Protection Agency.
U.S. Environmental Protection Agency. 2013. Information Concerning 2014 Clean Water Act Sections 303(d), 305(b), and 314 Integrated Reporting and Listing Decisions. September 3, 2013 Memorandum from U.S. EPA Office of Wetlands, Oceans and Watershed to U.S. EPA Regional Water Division Directors and U.S. EPA Region 1 Office of Environmental Measurement and Evaluation. Washington, D.C.: U.S. Environmental Protection Agency.
U.S. Environmental Protection Agency. 2015. Information Concerning 2016 Clean Water Act Sections 303(d), 305(b), and 314 Integrated Reporting and Listing Decisions. August 13, 2015 Memorandum from U.S. EPA Office of Wetlands, Oceans and Watershed to U.S. EPA Regional Water Division Directors and U.S. EPA Region 1 Office of Environmental Measurement and Evaluation. Washington, D.C.: U.S. Environmental Protection Agency.
U.S. Environmental Protection Agency. 2017. Information Concerning 2018 Clean Water Act Sections 303(d), 305(b), and 314 Integrated Reporting and Listing Decisions. December 22, 2017 Memorandum from U.S. EPA Office of Wetlands, Oceans and Watershed to U.S. EPA Water Division Directors, Regions 1-10 and U.S. EPA Environmental Services Division Directors. Washington, D.C.: U.S. Environmental Protection Agency.
Marylou Poppa Renshaw
Chief – Watershed Assessment and Planning Branch
Indiana Department of Environmental Management
100 North Senate Avenue
MC65-44 SHADELAND
Indianapolis, IN 46204-2251
(317) 308-3235; or toll free (800) 451-6027
E-mail: mrenshaw@idem.in.gov
Jody Arthur
Technical Environmental Specialist
Watershed Assessment and Planning Branch
Indiana Department of Environmental Management
100 North Senate Avenue
MC65-44 SHADELAND
Indianapolis, IN 46204-2251
(317) 308-3179; or toll free (800) 451-6027
E-mail: jarthur@idem.in.gov
APPENDIX 1
IDEM's 2020 Consolidated Assessment and Listing Methodology (CALM)
Section 305(b) of the 1972 Federal Clean Water Act (CWA) requires the U.S. Environmental Protection Agency (U.S. EPA) to provide a national water quality inventory report to Congress every two years. U.S. EPA develops its report with water quality assessment information provided, for the most part, by states through their water monitoring and assessment activities.
The Indiana Department of Environmental Management (IDEM) conducts water quality monitoring to meet a number of objectives, including to provide information to U.S. EPA for its national report. IDEM has developed this Consolidated Assessment and Listing Methodology (CALM) to guide its "305(b)" water quality assessment process. IDEM applies the decision making processes described in the CALM to the available data to determine whether the waters monitored are meeting their designated uses identified in Indiana's water quality standards (WQS).
Waters that do not meet Indiana's WQS are considered impaired and placed on Indiana's "303(d) List of Impaired Waters" as required by Section 303(d) of the CWA. This section of the CWA requires that states identify waters impaired for one or more of their designated uses and to establish total maximum daily loads (TMDLs) necessary for the waterbody to meet the applicable WQS for the use(s) that are impaired.
U.S. EPA guidance recommends that states, territories, and authorized tribes submit an Integrated Water Quality Monitoring and Assessment Report (IR) that will satisfy the CWA requirements for both the Section 305(b) water quality report and Section 303(d) List of Impaired Waters. IDEM adopted this recommendation in 2002 and, since then, provides its biennial IR to U.S. EPA in even-numbered years.
IDEM'S SURFACE WATER QUALITY MONITORING STRATEGY
IDEM has developed a water quality monitoring strategy (WQMS) that guides both its surface water quality and ground water quality monitoring activities. The goals of the WQMS in collecting surface water quality, biological, and habitat data are to:
• Assess all waters of the state to determine if they are meeting their designated uses and to identify those waters that are not.
• Support Office of Water Quality (OWQ) programs, including WQS development, National Pollutant Discharge Elimination System (NPDES) permitting, and compliance.
• Support public health advisories and address emerging water quality issues.
• Support watershed planning and restoration activities.
• Determine water quality trends and evaluate performance of programs.
• Engage and support a volunteer monitoring network across the state.
To achieve these goals, IDEM employs the following monitoring programs:
• Probabilistic monitoring in one basin per year on a nine-year rotating basin cycle.
• Trophic status monitoring of approximately 80 lakes each year by the Indiana University School of Public and Environmental Affairs (IU SPEA) Clean Lakes program.
• Fixed station monitoring at 165 sites across the state.
• Fish tissue and sediment contaminants monitoring on a five-year rotating basin cycle.
• Targeted (watershed characterization) monitoring for TMDL reassessments and development, watershed baseline planning, and performance measures determinations.
• Cyanobacteria monitoring of 10-12 lakes.
• Thermal verification monitoring.
• Special sampling projects.
• Hoosier Riverwatch volunteer stream monitoring.
IDEM's 305(b) assessment and 303(d) listing processes follow a nine-year, rotating basin schedule (Table 1), which ensures that all basins in the state are assessed at least once every nine years (Figure 1) (IDEM, 2010).
Table 1: IDEM's 305(b) rotating basin monitoring, assessment, reporting, and 303(d) listing schedule for aquatic life and recreational uses.
| | | | | |
| Sequence in IDEM's Rotating Basin Monitoring Strategy | Basin | Basin Monitored | Results for the Basin Assessed | Draft 303(d) List Published for Public Comment | Indiana's Integrated Report and 303(d) List Submitted to U.S. EPA |
| 1 | White River, West Fork Basin | 2011 | 2013 | 2013 | 2014 |
| 2 | Patoka River Basin | 2012 | 2014 | 2016 | 2016 |
| 3 | White River, East Fork Basin | 2013 |
| 4 | Great Miami River Basin (Whitewater River) | 2014 | 2015 |
| 5 | Upper Wabash River Basin | 2015 | 2016 | 2018 | 2018 |
| 6 | Lower Wabash River Basin | 2016 | 2017 |
| 7 | Upper Illinois River Basin (Kankakee and Iroquois Rivers) | 2017 | 2018 | 2020 | 2020 |
| 8 | Great Lakes Basin | 2018 | 2019 |
| 9 | Ohio River Tributaries | 2019 | 2020 | 2022 | 2022 |
| 1 | White River, West Fork Basin | 2020 | 2021 |
| 2 | Patoka River Basin | 2021 | 2022 | 2024 | 2024 |
| 3 | White River, East Fork Basin | 2022 | 2023 |
| 4 | Great Miami River Basin (Whitewater River) | 2023 | 2024 | 2026 | 2026 |
| 5 | Upper Wabash River Basin | 2024 | 2025 | 2028 | 2028 |
| 6 | Lower Wabash River Basin | 2025 | 2026 | 2028 | 2028 |
| 7 | Upper Illinois River Basin (Kankakee and Iroquois Rivers) | 2026 | 2027 | 2030 | 2030 |
| 8 | Great Lakes Basin | 2027 | 2028 | 2030 | 2030 |
| 9 | Ohio River Tributaries | 2028 | 2029 | 2032 | 2032 |
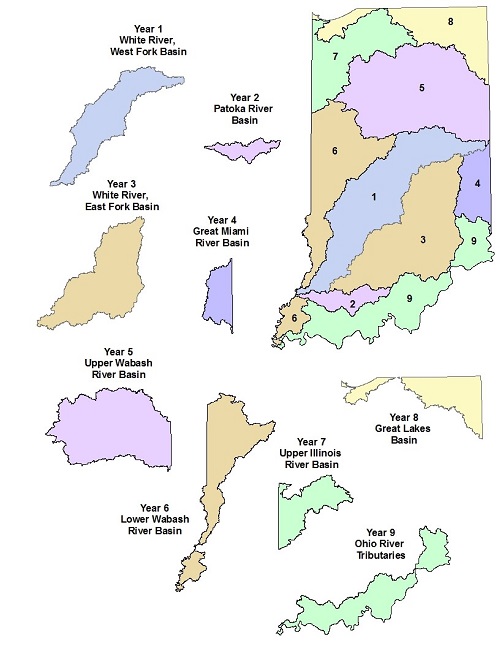
Figure 1: The nine major water management basins in Indiana as defined by IDEM to support the agency's rotating basin monitoring, assessment, reporting, and listing schedule.
Lakes and reservoirs in Indiana are monitored for IDEM by the Indiana Clean Lakes Program (CLP), administered by Indiana University's School of Public and Environmental Affairs. This monitoring does not follow the rotating basin due to the unequal distribution of lakes across the Indiana landscape. In 2010, The Indiana CLP began using a randomized approach to site selection with the goal of providing statistically significant lake water quality data that may eventually be applied to the entire state. From a universe of 320 lakes, 80 are chosen at random to be monitored each year.
WATERBODY ASSESSMENT UNITS
IDEM maintains its CWA Section 305(b) assessment and 303(d) listing information in U.S. EPA's Assessment, TMDL Tracking And Implementation System (ATTAINS) database. Each waterbody assessment unit (AU) is assigned a unique identifier in ATTAINS to which all assessment information for that waterbody is associated. This identifier is referred to as the assessment unit identifier (AUID).
In general, each AUID corresponds to the watershed in which it is located as defined by the United States Geological Survey (USGS) hydrologic unit code (HUC) system, which is a hierarchical system that divides and then subdivides the United States into successively smaller geographic areas based on surface hydrologic features or drainages. Under this system, the average size of an 8-digit hydrologic unit area in Indiana, commonly known as a subbasin, is about 448,000 acres (700 square miles). The 12- and 14-digit hydrologic unit areas, or subwatersheds, within an 8-digit hydrologic unit area are much smaller. The 12- and 14-digit hydrologic unit areas in Indiana range in size from less than five acres (less than one-hundredth of a square mile) to about 28,000 acres (almost 44 square miles).
The geographical extent and location of each AU within a given 12- or 14-digit HUC are defined for mapping purposes through a process called reach indexing. Reach indexing uses software tools that work with geographical information system (GIS) applications to delineate for a waterbody one or more units of assessment and to "key" these AUs (as defined by IDEM) to the National Hydrography Dataset (NHD)5. This "key" is called the Reach Index. IDEM's Reach Index facilitates mapping of Indiana's 305(b) assessments and 303(d) listings in GIS applications, and then incorporates this information into U.S. EPA's Assessment, Total Maximum Daily Load (TMDL) Tracking and Implementation System (ATTAINS).
In these databases, Indiana lakes and reservoirs, including Lake Michigan, are assigned a single AUID with sizes reported in acres. Each lake in ATTAINS is presently associated with the 14-digit HUC in which it resides. As time allows, IDEM will begin associating lakes with their 12-digit HUC to better support IDEM's nonpoint source program, which has adopted the 12-digit HUC scale for watershed management planning and implementation purposes.
Indiana's Lake Michigan shoreline is divided into reaches and assigned an AUID in accordance with the 8-digit HUC in which each shoreline reach is located. The shoreline is measured and reported in miles.
With the exception of the Ohio River whose AUIDs are likewise associated with their 8-digit HUCs, rivers and streams in IDEM's ADB are also divided into reaches with each one assigned a unique AUID in accordance with the 12-digit HUC in which it is located. River and stream reaches are measured in miles. Their sizes vary widely, and a single AU may or may not represent the entire stream to which it is associated.
The size of stream AUs is determined in large part by the hydrology of a system. This is because the mechanisms of large streams and rivers are very different from those of small streams and tributary systems thereby making it logical to separate these into individual AUs. Other factors, such as the following, are also considered when deciding how to define a water quality AU:
• Varying land uses within a watershed are considered because rural development can have different impacts on a stream than urban areas. This, in turn, has different impacts on a stream segment than do forested areas.
• The presence and locations of any permitted wastewater discharge facility is considered because the volume of its discharge can impact the hydrology of the receiving stream. The chemical makeup of its effluent can also impact water quality depending on the type of facility and whether the facility is operating effectively.
• IDEM also considers any other known factors that might reasonably be expected to impact hydrology or water quality, or both, such as the presence of dams and wetlands, and whether the stream has been channelized.
• Aerial photography provides additional information about the presence and thickness of riparian buffers, the presence and spatial extent of rural development, and the types of land use practices in the watershed.
All of these factors can help determine where differences in water quality might be expected to result. Due to the potential impacts these factors can have on stream water quality, they are all evaluated together when determining whether and where segmentation should occur along the stream reach.
The CWA provides the underpinning for Indiana's WQS, which are contained in
327 IAC 2 of the Indiana Administrative Code (IAC) and are designed to ensure that all waters of the state, unless specifically exempted, are safe for full body contact recreation and are protective of aquatic life, wildlife, and human health. These uses are described in the state's WQS as "designated" uses. IDEM monitors and assesses Indiana's surface waters to determine the extent to which they meet WQS and support their designated uses and to identify, where possible, the sources of impairment for those waters that do not support one or more of these uses.
OVERVIEW OF IDEM'S WATER QUALITY ASSESSMENT PROCESSES
The designated uses outlined in Indiana's WQS and the narrative and numeric criteria to protect them provide the basis for IDEM's 305(b) assessment process and 303(d) listing decisions. Water quality assessments are made by compiling existing and readily available data from site-specific chemical (water, sediment, and fish tissue), physical (habitat and flow), biological (fish and macroinvertebrate communities), and bacteriological (
E. coli) monitoring of Indiana's rivers, streams, and lakes and evaluating those data against Indiana's WQS. Waters identified as not meeting one or more of their designated uses are then placed on Indiana's 303(d) List of Impaired Waters. IDEM's decision making criteria include a combination of the narrative and numeric criteria stated in Indiana's WQS in
327 IAC 2.
Use support status is determined for each waterbody using the assessment guidelines provided in the U.S. EPA's documents regarding the 305(b) and 303(d) reporting methods outlined in the U.S. EPA "Guidance for 2004 Assessment, Listing and Reporting Requirements Pursuant to Sections 303(d), 305(b) and 314 of the Clean Water Act" (U.S. EPA, 2003), and the additional guidance provided in the U.S. EPA's memorandums containing information concerning CWA Sections 303(d), 305(b), and 314 integrated reporting and listing decisions for the 2006, 2008, 2010, 2012, 2014, 2016, and 2018 cycles (U.S. EPA, 2005-2017). Available results from the following six types of monitoring data listed below are integrated to provide an assessment for each waterbody for 305(b) reporting and 303(d) listing purposes:
• Physical or chemical water results.
• Fish community assessment.
• Benthic aquatic macroinvertebrate community assessments.
• Fish tissue and contaminant results.
• E. coli monitoring results.
The minimum data requirements for each type of assessment are provided in Table 2. For each AU with data meeting the minimum requirements for one or more designated uses, IDEM applies the assessment method for each use as described in later sections of this document. Assessment data are integrated for the purposes of making water quality assessments, meaning that all data for a given waterbody are considered together. In accordance with U.S. EPA policy, IDEM generally treats each type of data as independently applicable.
IDEM's methods for Ohio River Assessments, which are conducted in collaboration with the Ohio River Valley Sanitation Commission (ORSANCO) are covered in a separate section of this document. IDEM's CWA Section 314 assessments of lake trends and trophic state are also described in this document.
Table 2: Minimum data requirements for CWA assessments.
| | |
| Parameter Type | Minimum Information Required for Assessment | Index Period |
| Aquatic Life Use Support – Rivers and Streams |
| Toxicants | Minimum of three measurements | Most recent five consecutive years |
| Conventional Inorganics | Minimum of three measurements | Most recent five consecutive years |
| Nutrient Parameters | Minimum of three measurements and two or more of parameters must have been exceeded on same date in order to classify a waterbody as impaired. | Most recent five consecutive years |
| Benthic aquatic macroinvertebrate Index of Biotic Integrity (mIBI) | Minimum of one measurement, preferably with corresponding qualitative habitat use evaluation (QHEI) score* | Most recent five consecutive years |
| Fish community (IBI) | Minimum of one measurement, preferably with corresponding qualitative habitat use evaluation (QHEI) score* | Most recent five consecutive years |
| *The Qualitative Habitat Evaluation Index (QHEI) is not required to determine aquatic life use support but is used, when available, in conjunction with macroinvertebrate community scores (mIBI) or fish community scores (IBI), or both, to evaluate the role that habitat plays in waterbodies where biological integrity impairments have been identified. |
| Fish Consumption Use Support (Human Health) |
| PCBs in Fish Tissue | One actual concentration value for the site for a single species and size class | Most recent 12 consecutive years |
| Mercury in Fish Tissue | One trophic level weighted arithmetic mean concentration value calculated on all samples from the site from a single sampling event | Most recent 12 consecutive years |
| Recreational Use Support (Human Health) – All Waters |
| Bacteria (E. coli) | Minimum of ten grab samples or one geometric mean result calculated from five equally-spaced samples over thirty days. | Most recent five consecutive years |
| Recreational Use Support (Aesthetics) – Lakes and Reservoirs |
| Natural Lakes and Reservoirs | Minimum of three total phosphorus results with corresponding Chlorophyll a results collected over three years (consecutive or nonconsecutive). All readily available data for a given lake that meets IDEM's data quality requirements are evaluated for potential use in assessments. |
| Public Water Supply Use Support – All Waters |
| Chemical Toxicants | Minimum of three measurements collected within the same year at least one month apart | Most recent five consecutive years |
| Cyanobacterial Toxins | Minimum of one measurement
Or
One consumption and use notification issued by a water treatment facility based on cyanobacterial toxin concentrations in treated drinking water | Most recent five consecutive years |
| Conventional Inorganics | Minimum of three measurements collected within the same year at least one month apart | Most recent five consecutive years |
| Bacteria | All Level 1 or Level 2 assessments, or both, performed in accordance with the Revised Total Coliform Rule (RTCR) | Most recent five consecutive years |
IDEM collaborates with the Ohio River Valley Water Sanitation Commission (ORSANCO) to conduct water quality assessments of the Ohio River reaches that border Indiana. ORSANCO is an interstate water pollution control agency for the Ohio River established through a compact agreement between member states and approved by Congress in 1948. The compact can be found online at: http://www.orsanco.org/orsanco-compact. Under the terms of this agreement, member states cooperate in the control of water pollution in the Ohio River Basin.
ORSANCO monitors the Ohio River on behalf of the compact states under CWA Section 305(b) and produces a water quality assessment report of its water quality condition every two years. Although this report identifies water quality issues on the Ohio River, ORSANCO, unlike its compact states, is not required to develop a 303(d) List of Impaired Waters. Identifying Ohio River impairments on a 303(d) list for the purposes of TMDL development is the responsibility of each compact state.
ORSANCO actively works with compact states to review its 305(b) assessment methodologies and revise them as needed. Every two years, ORSANCO prepares a description of the proposed assessment methodology for review by the 305(b) Work Group, which is made up of the state agency personnel responsible for preparing the Integrated Reports in each state and one or more U.S. EPA representatives responsible for reviewing state reports. At this time, provisional assessments based on proposed methods are also presented to the 305(b) Work Group for discussion. ORSANCO works with the 305(b) Work Group to achieve a consensus regarding its assessment methods and water quality assessments based on them. After ORSANCO's methodology and preliminary assessments are approved by the 305(b) Work Group, ORSANCO then presents them to its Technical Committee for final approval.
It is important to note that ORSANCO's assessment and reporting timeline does not correspond with IDEM's publication of its draft 303(d) list for public review and comment. ORSANCO's assessment methodology and its preliminary assessments for each cycle are always completed prior to or during IDEM's development of its draft 303(d) list for that cycle. However, they are considered provisional until presented to ORSANCO's Technical Committee for approval, which usually occurs after IDEM has published its draft 303(d) list for public comment.
In order to provide the public with the most current assessment information available for the Ohio River, IDEM includes ORSANCO's preliminary assessments and the methods upon which they are based in Indiana's draft 303(d) list and the CALM published each cycle. It should be understood, however, that ORSANCO's assessment methods as described in the CALM, along with any new Ohio River impairments added to or previously identified and removed from Indiana's draft 303(d) list, are provisional and may change based on approval of ORSANCO's Technical Committee.
ORSANCO's role in completing Ohio River use attainment assessments and developing a biennial report on Ohio River water quality conditions is primarily to facilitate interstate consistency in CWA 305(b) assessments and how impairments are identified on the compact states' 303(d) lists for the purposes of TMDL development. This consistency is not always possible given the differences in the compact states' WQS and their CWA Sections 305(b) and 303(d) assessment and listing methodologies. Given these differences, the compact states are not obligated to incorporate ORSANCO's water quality assessments into their own reports. U.S. EPA guidance states that "data and information in an interstate commission 305(b) report should be considered by the states as one source of readily available data and information when they prepare their Integrated Report and make decisions on segments to be placed in Category 5; however, data in a 305(b) Interstate Commission Report should not be automatically entered in a state Integrated Report or 303(d) list without consideration by the state about whether such inclusion is appropriate." (U.S. EPA, 2005).
As Indiana is a member state of the Compact, IDEM actively participates in ORSANCO's decision making processes regarding its monitoring strategy and biennial water quality assessments. Thus, those assessments that IDEM incorporates into its 303(d) list and the data upon which they are based have been reviewed by IDEM and are considered to be appropriate for use in the development of Indiana's 303(d) list.
Attachment A contains a comparison of the relative stringencies of applicable criteria in ORSANCO's Pollution Control Standards (PCS) and Indiana's WQS and the different ways in which these criteria are used to determine the degree to which the Ohio River supports aquatic life use, recreational use, and fish consumption. In order to achieve consistency with other compact states, IDEM generally accepts ORSANCO's methods for evaluating the available data for assessment purposes. And, where there are not significant differences between ORSANCO's criteria and those expressed in Indiana's WQS, IDEM incorporates ORSANCO's biennial assessments directly into its Integrated Report and 303(d) list, applying them to the corresponding reaches defined in ATTAINS. However, in cases where the water quality criteria ORSANCO uses are less stringent than the water quality criteria contained in Indiana's WQS, its methods for applying them are significantly inconsistent with IDEM's assessment methodology, or both situations exist, ORSANCO's data are evaluated against IDEM's assessment methodology. The results are then compared to Indiana's WQS to make the assessment. IDEM's methods for applying ORSANCO's assessments, data, or both for the purposes of Integrated Reporting are described below and summarized in Table 3.
IDEM's Assessment Units for the Ohio River
The Ohio River is a series of 20 pools resulting from a series of high-lift locks and dams that bisect the river. These dams were installed for navigational purposes to maintain a minimum river depth and to regulate flow. These pools range from around six to almost 130 miles long, and each has its own unique characteristics that can affect water quality. The beginning and end points of each pool are defined in terms of their Ohio River Miles (ORM). There are five pools located along Indiana's border:
• Markland Pool (ORM 491.1 to ORM 531.6)
• McAlpine (ORM 531.6 to ORM 609.4)
• Cannelton (ORM 609.4 to ORM 722.9)
• Newburgh (ORM 722.9 to ORM 853.5)
• JT Myers (ORM 853.5 to ORM 855.3)
For its aquatic life use and fish consumption, ORSANCO applies the results of its assessment to the entire pool from which the data were collected, while its recreational use support assessments are reported in terms of river miles. ORSANCO's assessments of public water supply are provided for the entire river as a whole.
IDEM has divided the Indiana reaches of the Ohio River into individual assessment units within each pool for the purposes of assessment. IDEM's assessment units range from 1.8-13.7 miles long and allow IDEM to more accurately apply ORSANCO's recreational use assessments to specific reaches within each pool. For aquatic life use and fish consumption, IDEM applies ORSANCO's results for each pool to all the IDEM assessment units within the pool. Attachment B provides a key showing how IDEM's assessment units correspond to the pools identified in ORSANCO's biennial assessments.
Aquatic Life Use Assessments for the Ohio River
ORSANCO monitors both the biological communities (fish and macroinvertebrates) and chemical water quality at several sites along the Ohio River to determine the degree to which the Ohio River supports aquatic life.
Physical and chemical water quality data are collected bimonthly from about 15 fixed sites along the Ohio River, most of which are located at the navigational dams that divide the river into pools, five of which are either partly or wholly located along Indiana's border. Biological monitoring is conducted in three to five pools each year at 15 randomly chosen sites in each pool, resulting in an assessment data set for the entire river every six years.
ORSANCO uses two biological indices specifically designed for the Ohio River, both of which induce different metrics to measure the condition of biological communities in the river. For fish community assessments of the Ohio River, ORSANCO uses the modified Ohio River Fish Index (mORFIn), which was developed based on the nationally used Index of Biotic Integrity (IBI) designed to assess smaller streams. Both the mORFIn and the Ohio River Macroinvertebrate Index (ORMIn) have been customized to assess the Ohio River with expected values developed for the different habitats found in this large river system. These indices combine various attributes of the aquatic communities they measure to provide two scores for each pool in the river based on its biology. Individual mORFIn and ORMIn scores for each site are compared to their expected scores to determine the biological condition rating for each type of community, which ranges from excellent to very poor. For the purposes of assessment, ORSANCO calculates an average mORFIn and ORMIn scores for each pool based on the individual scores from all sites monitored within the pool.
ORSANCO determines chemical water quality conditions for each pool by comparing water sample results6 for each site within the pool to the applicable criteria in Indiana's WQS or ORSANCO's PCS (Ohio River Valley Sanitation Commission, 2006), whichever are more stringent (CALM Attachment A). The results for biological and chemical water quality assessments are then evaluated together to determine use support in the manner described in Table 3.
IDEM accepts ORSANCO's approach to evaluating both biological and water chemistry data. However, because Indiana's water quality criteria differ for some parameters from ORSANCO's criteria, assessments reported in ORSANCO's 305(b) report may differ somewhat from those in Indiana's Integrated Report depending on the parameter in question and whether ORSANCO's or Indiana's criterion is more stringent.
Recreational Use Assessments for the Ohio River
ORSANCO conducts at least five rounds of weekly sampling for bacteria at sites located upstream and downstream of six urban communities along the Ohio River. These are communities that have combined sewer overflows (CSOs), which can be significant sources of bacterial contamination to surface waters during wet weather events. Samples are analyzed for fecal coliform and Escherichia coli (E. coli). ORSANCO also monitors bacteria during the recreation season at five-mile intervals along the entire river. Sites are sampled weekly for a five-week period to allow for the calculation of a geometric mean for each site.
ORSANCO uses geometric mean E. coli results from all sites to determine recreational use support, comparing them to the E. coli criteria in ORSANCO's PCS. Indiana's E. coli criteria are slightly more stringent than ORSANCO's. However, in cases where there are at least ten samples at a given site, up to 10% of the results may exceed the single sample maximum criterion if the exceedances are incidental and attributable solely to the discharge of treated wastewater from a wastewater treatment and the geometric mean criterion is met7.
Unlike Indiana's WQS, ORSANCO's criteria do not allow exceptions for E. coliexceedances. This, combined with the fact that ORSANCO also directly applies its single sample maximum criterion to individual results, makes ORSANCO's recreational use assessments more stringent than Indiana's by virtue of its assessment methodology. Indiana, therefore, accepts ORSANCO's assessments of recreational use support for the Ohio River.
Public Water Supply Use Support Assessments for the Ohio River
To determine whether the Ohio River is meeting its use as a public water supply (PWS), ORSANCO combines the results from its bacteria monitoring and bimonthly chemical monitoring programs with information from surveys of drinking water treatment facilities and U.S. EPA's Safe Drinking Water Information System (SDWIS) database.
Each assessment cycle, ORSANCO mails surveys to all Ohio River water utilities requesting information about the quality of the source water they draw from the Ohio River. For Indiana, three facilities are contacted (Mt. Vernon, Evansville, and New Albany). The surveys ask utilities if there were any intake closures during the assessment period due to spills, whether violations of finished drinking water maximum contaminant levels (MCLs) occurred due to source water quality, or whether "non-routine" or extraordinary treatment due to source water quality was necessary to meet finished water MCLs.
ORSANCO also queries SDWIS for records of MCL violations within the assessment period for all Ohio River water utilities. For Indiana, this includes three facilities (Mt. Vernon, Evansville, and New Albany).
This information is evaluated as shown in Table 3 to determine whether the Ohio River as a whole is meeting its use as a public water supply.
Fish Consumption Assessments for the Ohio River
In addition to its designated use support assessments for aquatic life, recreation, and public water supply, ORSANCO also conducts assessments to determine the degree to which the Ohio River supports fish consumption. In applying these assessments to Indiana reaches of the Ohio River, IDEM emphasizes that this information is not intended to be a public health advisory. IDEM recommends that the public refer either to the most current Indiana Fish Consumption Advisory (FCA), contact the Indiana State Department of Health (ISDH), or consult both, with any specific questions or concerns regarding the health risks associated with consuming fish caught from the Ohio River. Important differences between fish consumption use impairments identified as a result of these assessments and the health advisories provided in the FCA are discussed in more detail in the section describing Indiana's assessment methodology for fish consumption for other Indiana waters and Lake Michigan.
ORSANCO uses both fish tissue data and water sample results to make its fish consumption use assessments, and its methods for evaluating the data differ somewhat from IDEM's methods for similar assessments on other Indiana waters. Unlike ORSANCO's methodology, IDEM's assessment methodology relies on fish tissue data only and requires only one exceedance of the applicable criterion to assess impairment. IDEM's methods are intended to result in a more conservative estimate of conditions in smaller rivers and streams for which there are commonly less available data.
In contrast, the Ohio River is a large and complex river system. The data provided for the assessment of fish consumption use support by ORSANCO monitoring programs result in a far more robust data set than those available for similar assessments of other Indiana waters. IDEM's collaboration with ORSANCO allows IDEM to focus its monitoring resources on other waters. As a result, IDEM's monitoring on the Ohio River is comparatively quite limited.
For most of the Ohio River, IDEM accepts ORSANCO's assessment methodology for fish consumption use support. Results for methylmercury and PCBs in fish tissue are reviewed independently of ORSANCO results using the same methods applied to other waters in the state for those reaches where IDEM has sampled for fish tissue. Where IDEM's assessment for a given reach differs from ORSANCO's assessment, IDEM accepts ORSANCO's assessment because it is typically based upon a more recent and robust data set.
In 2012, ORSANCO's Technical Committee approved the use of the U.S. EPA guidance issued in 2010 for implementing the national methylmercury water quality criterion in CWA programs and began using this methodology for its 2014 cycle assessments. The criteria ORSANCO applies in its fish consumption assessments are shown in Table 4. ORSANCO's criterion for methylmercury in fish tissue is equivalent to that used by IDEM in its fish consumption assessments on other waters.
In addition to fish tissue data, ORSANCO's monitoring programs provide results for PCBs, dioxin, and total mercury in the water column. For PCBs and dioxin, ORSANCO's criteria are more stringent than those contained in Indiana's WQS. For total mercury, Indiana's criterion is more stringent than ORSANCO's.
ORSANCO does not currently monitor for PCBs in fish tissue. If such data become available in the future, IDEM will apply its 0.02 μg/l fish tissue criterion for PCBs using ORSANCO's 10% rule as shown in Table 3.
Table 3: Water quality assessment criteria for determining designated use support for the Ohio River.
| | |
| Aquatic Life Use Support – Ohio River |
| ORSANCO combines the results from both its biological and chemical water quality monitoring programs to determine aquatic life use support for the Ohio River. To determine biological integrity of a given pool, average scores for the Ohio River modified Fish Index (mORFIn) and Ohio River Macroinvertebrate Index (ORMin) are calculated for each pool from the individual scores for all sites monitored within the pool and compared to expected scores to determine a biological rating for the pool. Chemical water quality conditions are determined for each pool by comparing water sample results8 for each site within the pool to the applicable criteria in Indiana's WQS or ORSANCO's Pollution Control Standards (PCS) (Ohio River Valley Sanitation Commission, 2006), whichever are more stringent. The results for biological and chemical water quality assessments are evaluated together to determine use support in the manner described below. |
| Pollutants (conventional inorganics and toxicants) and biological communities (fish and macroinvertebrates) | Assessments of chemical water quality are based on results for conventional inorganics (pH, sulfate, and chloride) and toxicants (dissolved metals, total mercury, total selenium, polychlorinated biphenyls (PCBs), dioxins, free cyanide, and ammonia). Results are evaluated on a site-by-site basis. Exceedances are determined by comparing results for each site to the applicable criteria in Indiana's WQS or ORSANCO's PCS, whichever are more stringent. |
| Fully Supporting | Not Supporting |
Not more than 10% of all water samples exceed applicable criterion for a given pollutant
And
Average mORFIn and ORMIn scores for the pool are greater than or equal to 20, which indicates a biological rating of "Fair" to "Excellent" | More than 10% of all water samples exceed applicable criterion for a given pollutant
And/Or
Average mORFIn and/or ORMIn scores for the pool are less than 20, which indicates a biological rating of "Poor" to "Very Poor" |
| Fish Consumption Use Support (Human Health) – Ohio River |
ORSANCO monitoring results for total mercury, PCBs, and dioxin in water samples were evaluated for the exceedance(s) of the applicable criteria in Indiana's WQS or ORSANCO's PCS, whichever is more stringent, and the number of times the exceedance(s) occurred. ORSANCO results for methylmercury in fish tissue samples were evaluated for the exceedance(s) of the applicable criteria in Indiana's WQS or ORSANCO's PCS, whichever is more stringent, and the number of times the exceedance(s) occurred. For sites where ORSANCO's water sample results conflict with its fish tissue results for the same pollutant, the fish tissue results are given more weight in the assessment decision. ORSANCO does not monitor for PCBs in fish tissue.
ORSANCO uses a modified version that is a trophic level weighted arithmetic mean with trophic level 2 fish removed from the calculation. IDEM's methodology for assessing methylmercury in fish tissue is similar to ORSANCO's. However, based on ORSANCO's most robust data set for this large river, IDEM defers to ORSANCO's methodology for the assessment of fishable use support for the Ohio River.
IDEM results for methylmercury and PCBs in fish tissue are reviewed independently of ORSANCO results using the same
methods applied to other waters in the state. Where IDEM's assessment for a given reach differs from ORSANCO's assessment, IDEM accepts ORSANCO's assessment. |
| Polychlorinated biphenyls (PCBs) and Dioxin in Water Samples | Fully Supporting | Not Supporting |
| Not more than 10% of water sample results exceed the applicable water quality criterion | More than 10% of water sample results exceed the applicable water quality criterion |
| Polychlorinated biphenyls (PCBs) in Fish Tissue Samples | Actual concentration values for all samples are less than or equal to 0.02 mg/kg wet weight | Actual concentration values for one or more samples are greater than 0.02 mg/kg wet weight |
| Mercury in Fish Tissue and Water Samples | Trophic level weighted arithmetic mean concentration values for all sampling events are less than or equal to 0.3 mg/kg wet weight | Trophic level weighted arithmetic mean concentration values for one or more sampling events are greater than 0.3 mg/kg wet weight |
| Recreational Use Support (Human Health) – Ohio River |
| Available data are evaluated in two ways. Both individual results and monthly geometric mean results calculated from five samples, one sample collected each week for five consecutive weeks, are evaluated for exceedances of the applicable criteria in ORSANCO's PCS and the number of times exceedances occurred. |
| Bacteria (E. coli) | Fully Supporting | Not Supporting |
Not more than 10% of the monthly geometric mean results exceed the geometric mean criterion of 130 cfu/100mL
And
Not more than 10% of all single sample results exceed the instantaneous maximum criterion of 240 cfu/100 mL | More than 10% of the monthly geometric mean results exceed the geometric mean criterion of 130 cfu/100mL
Or
More than 10% of all single sample results exceed the instantaneous maximum criterion of 240 cfu/100 mL |
| Public Water Supply – Ohio River |
| ORSANCO combines the results from its bacteria and chemical water quality monitoring programs with results from surveys of drinking water facilities and information from U.S. EPA's Safe Drinking Water Act Information System (SDWIS) to determine public water supply use support for the Ohio River. |
| Chemical pollutants, bacteria, and information from surveys of drinking water facilities and SDWIS | Assessments of chemical water quality are based on results for bacteria (fecal coliform), conventional inorganics (fluoride, total nitrogen and nitrite, and sulfate) and other substances regulated under the SDWA with either a maximum concentration limit (MCL) or secondary MCL. These include total metals, total cyanide, and phenols. Results for bacteria and chemical pollutants are evaluated on a site-by-site basis. Exceedances are determined by comparing results for each site to the applicable criteria in Indiana's WQS or ORSANCO's PCS, whichever are more stringent. |
| Fully Supporting | Not Supporting |
Not more than 10% of water sample results exceed the applicable water quality criterion
And
No finished water MCL violations caused by Ohio River water quality were reported | More than 25% of water sample results exceed the applicable criterion
Or
More than 10% of water sample results exceed the applicable water quality and a corresponding finished water MCL violation caused by Ohio River water quality was reported
Or
Frequent closures due to elevated levels of pollutants were necessary to protect water supplies and meet MCLs
Or
Frequent "non-routine" additional treatment was necessary to protect water supplies and to meet MCLs |
| Pollutants | Actual concentration values for all samples are less than or equal to 0.02 mg/kg wet weight | Actual concentration values for one or more samples are greater than 0.02 mg/kg wet weight |
| Mercury in Fish Tissue and Water Samples | Trophic level weighted arithmetic mean concentration values for all sampling events are less than or equal to 0.3 mg/kg wet weight | Trophic level weighted arithmetic mean concentration values for one or more sampling events are greater than 0.3 mg/kg wet weight |
With regard to mercury in the water column, ORSANCO's chronic aquatic life use criterion for total mercury in ambient waters is less stringent than the criterion used by Indiana downstate (outside of the Great Lakes basin). ORSANCO applies this criterion in its assessments of fish consumption use support as opposed to aquatic life use support because it considers bioaccumulation of mercury in fish tissue more of a human health concern than a threat to aquatic life. IDEM concurs with ORSANCO's use of water column results for mercury in assessments of fish consumption use based on this rationale and accepts ORSANCO's fish consumption use assessments for the Ohio River. Unlike ORSANCO, IDEM also applies the chronic criterion for total mercury in its assessments of aquatic life use support on the Ohio River. Based on Indiana's decision to use ORSANCO's total mercury results for aquatic life use assessments, Indiana's record of aquatic life use impairments may differ from those reported by ORSANCO in its biennial CWA 305(b) report.
For fish consumption assessments at sites where the results for total mercury or PCBs, or both, in water conflict with the fish tissue results for that same contaminant, the fish tissue results are given more weight in the assessment decision. This is because fish tissue levels of these contaminants are an indicator of more direct potential mercury exposure to individuals consuming fish from the Ohio River, whereas their concentrations in the water column are more of an indicator of potential bioaccumulation than direct impacts from consumption. IDEM concurs with this approach.
Table 4: Assessment criteria used by ORSANCO and IDEM to determine fish consumption use support for the Ohio River.
| | |
| Mercury (Hg) |
| | Fully Supporting | Not Supporting |
| Concentration in Fish Tissue | Less than or equal to 0.3 (mg/kg wet weight) | Greater than 0.3 (mg/kg wet weight) |
| Concentration in Water | Less than or equal to 0.012 μg/L | Greater than 0.012 μg/L |
| Polychlorinated Biphenyls (PCBs) |
| | Fully Supporting | Not Supporting |
| Concentration in Fish Tissue | Less or equal to 0.02 (mg/kg wet weight) | Greater than 0.02 (mg/kg wet weight) |
| Concentration in Water | Less than or equal to 0.000064 μg/L | Greater than 0.000064 μg/L |
| Dioxin |
| | Fully Supporting | Not Supporting |
| Concentration in Water | Greater than 0.000000005 μg/L | Greater than 0.000000005 μg/L |
AQUATIC LIFE USE ASSESSMENTS
Use Support Criteria for Biological Data
Biological assessments for streams are based on the sampling and evaluation of either the fish communities or benthic aquatic macroinvertebrate communities, or both. The Index of Biotic Integrity (IBI) score for fish or the macroinvertebrate Index of Biotic Integrity (mIBI) score, or both, were calculated and compared to regionally-calibrated models. In evaluating fish communities, streams rating as "fair" or worse are classified as nonsupporting for aquatic life uses. For benthic aquatic macroinvertebrate communities, individual sites are compared to a statewide calibration at the lowest practical level of identification for Indiana. All sites at or above background for the calibration are considered to be supporting aquatic life uses. Those sites rated as moderately or severely impaired in the calibration are considered to be nonsupporting. Waters with identified impairments to one or more biological communities are considered not supporting aquatic life use. The process IDEM uses to make designated use support decisions is shown in Table 5. The biological thresholds upon which this process is based are shown in Table 6 to provide greater context for understanding the range of biological conditions that is considered either fully supporting or impaired.
IDEM's aquatic life use assessments are never based solely on habitat evaluations. However, habitat evaluations are used as supporting information in conjunction with biological data to determine aquatic life use support. Such evaluations, which take into consideration a variety of habitat characteristics as well as stream size, help IDEM to determine the extent to which habitat conditions may be influencing the ability of biological communities to thrive. If habitat is determined to be driving a biological integrity impairment and no other pollutants that might be contributing to the impairment have been identified, the biological integrity impairment is not considered for inclusion on IDEM's 303(d) List of Impaired Waters (Category 5). In such cases, the waterbody is instead placed in Category 4C for the biological impairment.
Table 5: Water quality assessment methodology for determining aquatic life use support.
| | |
| Aquatic Life Use Support - Rivers and Streams |
| Toxicants | Dissolved metals, pesticides, polychlorinated biphenyls (PCBs), polynuclear aromatic hydrocarbons (PAHs), free cyanide, and ammonia were evaluated on a site-by-site basis and judged according to the magnitude of the exceedance(s) of Indiana's WQS and the number of times the exceedance(s) occurred. For any one pollutant (grab or composite samples), the following assessment criteria are applied to data sets consisting of three or more measurements. |
| Fully Supporting | Not Supporting |
| Not more than one exceedance of the acute or chronic criteria for aquatic life within a three year period9. | More than one exceedance of the acute or chronic criteria for aquatic life within a three year period. |
| Conventional inorganics | Dissolved oxygen, pH, sulfate, and chloride were evaluated for the exceedance(s) of Indiana's WQS. For any one pollutant, the following assessment criteria are applied to data sets consisting of three or more measurements. |
| Fully Supporting | Not Supporting |
| Criteria are exceeded in less than or equal to 10% of measurements. | Criteria are exceeded in greater than 10% of measurements. |
| Nutrients | Nutrient conditions were evaluated on a site-by-site basis using the benchmarks described below. In most cases, two or more of these conditions must be met on the same date in order to classify a waterbody as impaired. This methodology assumes a minimum of three sampling events:
° Total Phosphorus -- One or more measurements greater than 0.3 mg/L
° Nitrogen (measured as Nitrate + Nitrite) – One or more measurements greater than 10.0 mg/L
° Dissolved Oxygen – One or more measurements below the water quality standard of 4.0 mg/L or measurements that are consistently at or close to the standard, in the range of 4.0-5.0 mg/L, and/or one or more saturation values greater than 120%
° pH measurements – One or more measurements exceed the water quality standard of not more than 9.0 pH units or measurements are consistently at or close to the standard, in the range
of 8.7- 9.0 pH units
° Algal Conditions -- Algae are described as "excessive" based on field observations by IDEM scientists. |
| Benthic aquatic macroinvertebrate Index of Biotic Integrity (mIBI) Scores (Range of possible scores is 12-60) | Fully Supporting | Not Supporting |
| mIBI greater than or equal to 36 | mIBI less than 36 |
| Fish community (IBI) Scores (Range of possible scores is 0-60) | IBI greater than or equal to 36 | IBI less than 36 |
| Aquatic Life Use Support – Rivers and Streams |
| Qualitative habitat use evaluation (QHEI) (Range of possible scores is 0-100) | The Qualitative Habitat Evaluation Index (QHEI) is not used to determine aquatic life use support. Rather, the QHEI is an index designed to evaluate the lotic habitat quality important to aquatic communities and is used in conjunction with mIBI or IBI data, or both, to evaluate the role that habitat plays in waterbodies where biological integrity impairments have been identified. QHEI scores are calculated using six metrics: substrate, instream cover, channel morphology, riparian zone, pool/riffle quality, and gradient. A higher QHEI score represents a more diverse habitat for colonization of aquatic organisms. IDEM has determined that a QHEI total score of <51 indicates poor habitat. For streams where the macroinvertebrate mIBI or IBI scores indicate the biological integrity of the waterbody is impaired, QHEI scores are evaluated to determine if habitat is the primary stressor on the aquatic communities, or if there may be other stressors/pollutants causing the biological integrity impairment. |
Table 6: Biological thresholds upon which IDEM's assessment method for aquatic life use support is based.
| | | |
| Biotic Index Score and Associated Assessment Decision | Integrity Class | Corresponding Integrity Class Score | Attributes |
| Macroinvertebrate Community Data Collected With Artificial Samplers (used in assessments prior to 2010 cycle) |
| mIBI greater than or equal to 1.8 (artificial substrate sampler) indicates full support | Excellent | 6.0-8.0 | NA |
| Good | 4.0-5.9 | NA |
| Fair | 1.8-3.9 | NA |
| mIBI less than 1.8 (artificial substrate sampler) indicates impairment | Poor | 1.0-1.7 | NA |
| Very Poor | 0-0.9 | NA |
| Macroinvertebrate Community Data Collected Using Kick Methods (used in assessments prior to 2010 cycle) |
| mIBI greater than or equal to 2.2 (kick methods) indicates full support | Excellent | 6.0-8.0 | NA |
| Good | 4.0-5.9 | NA |
| Fair | 2.2-3.9 | NA |
| mIBI less than 2.2 (kick methods) indicates impairment | Poor | 1.0-2.1 | NA |
| Very Poor | 0-0.9 | NA |
| Macroinvertebrate community data collected using multihabitat (mHAB) methods (used in assessments from the 2010 cycle to present) |
| mIBI greater than or equal to 36 indicates full support | Excellent | 53-60 | Comparable to "least impacted" conditions, exceptional assemblage of species. |
| Good | 45-52 | Decreased species richness (intolerant species in particular), sensitive species present. |
| Fair | 36-44 | Intolerant and sensitive species absent, skewed trophic structure. |
| mIBI less than 36 indicates impairment | Poor | 23-35 | Many expected species absent or rare, tolerant species dominant. |
| Very Poor | 13-22 | Few species and individuals present, tolerant species dominant. |
| No Organisms | 12 | No macroinvertebrates captured during sampling. |
| Fish Community Data |
| IBI greater than or equal to 36 indicates full support | Excellent | 53-60 | Comparable to "least impacted" conditions, exceptional assemblage of species. |
| Good | 45-52 | Decreased species richness (intolerant species in particular), sensitive species present. |
| Fair | 36-44 | Intolerant and sensitive species absent, skewed trophic structure. |
| IBI less than 36 indicates impairment | Poor | 23-35 | Top carnivores and many expected species absent or rare, omnivores and tolerant species dominant. |
| Very Poor | 1-22 | Few species and individuals present, tolerant species dominant, diseased fish frequent. |
| No Organisms | 0 | No fish captured during sampling. |
Revisions to IDEM's Use Support Criteria for Biological Data
IDEM's use support criteria for fish community and macroinvertebrate community data have undergone significant changes since they were first adopted in 1996. Table 7 summarizes the evolution of IDEM's criteria for making assessments with biological data.
The biological criteria that were developed for both fish and macroinvertebrate communities for the 2004 305(b) and 303(d) assessment and listing cycle were calibrated to reference conditions throughout Indiana and applicable to all waters. However, the resulting criteria were applied only to the basins being assessed at the time. For the 2006 cycle, IDEM began reviewing all aquatic life use support assessments made in the remaining basins throughout the state prior to 2002 to ensure their consistency with the statewide criteria developed in 2004. This review was completed for the 2008 cycle.
Although the fish community criteria developed in 2004 remain in effect today, IDEM revised its assessment methods for evaluating macroinvertebrate data for the 2010 cycle.
The statewide mIBI developed for the 2004 cycle was based on riffle/run samples collected throughout the state from 1990 through 1994. The Office of Water Quality (OWQ) used the riffle/run method from 1996 through 2003, collecting samples at some of the same sites sampled for the original calibration of the index that were randomly selected for follow-up sampling. Beginning in 1998, the OWQ also collected samples at probabilistic sites chosen for the Watershed Monitoring Program where a suitable riffle/run habitat was present. Unfortunately, less than half of the probabilistic sites sampled during this time had riffle/run type habitats within the allowed distance, which reduced the effectiveness of the riffle/run method as a monitoring tool. This necessitated the development of a macroinvertebrate sampling method which could be used at all probabilistic sites, regardless of habitat.
The new multihabitat method (mHAB) mIBI differs primarily from the riffle/run method in that it samples all habitats available at a stream site using a D-frame net instead of the kick screen used in the riffle/run method. In 2004, 62 sites (a subset selected from all sites previously sampled with the riffle/run method between 1990 and 2003) were re-sampled with the new mHAB method. The idea was to develop an index calibrated not on the best possible reference conditions but on a normal distribution of stream conditions based on mIBI scores obtained at previously sampled sites. It was later determined that this was too few samples to develop a statewide index; therefore, these samples were combined with probabilistic samples collected in 2005, 2006, and 2007 (a total of 247 samples) to develop the index currently in use.
Twelve metrics were chosen from a pool of more than 100 possible metrics in the development of the new mIBI. These 12 metrics provided the best correlation to the data and describe a diversity of features that characterize the quality of a stream or river. The scores for each individual metric are totaled and can range from 12 to 60. As with the fish community IBI, mIBI scores less than 36 are considered nonsupporting of aquatic life use while those greater than or equal to 36 are supporting of aquatic life use.
Table 7: Evolution of the criteria used in making aquatic life use assessments with biological data.
| |
| Cycle | Criteria Development and Changes |
| 1998 | IDEM used Karr's 1986 Index of Biotic Integrity (IBI) Classification and Attributes Table to establish criteria to apply to fish community (IBI) data for use support assessments:
° IBI greater than or equal to 44 = Fully supporting (Excellent/Good)
° IBI between 44 and 22 = Partially supporting (Fair/Poor)
° IBI less than 22 = Not supporting (Very Poor/No Fish)
IDEM's criteria for macroinvertebrate community (mIBI) data collected using kick methods:
° mIBI greater than or equal to 4 = Fully supporting
° mIBI between 4 and 2 = Partially supporting
° mIBI less than 2 = Not supporting |
| 2000 | IDEM reviewed fish community data from 1990-1995 (a total of 831 samples) to determine new, more accurate limits reflective of Indiana fish communities by subtracting 1/2 standard deviation from the statewide mean to calculate the following criteria:
° IBI greater than or equal to 34 = Fully supporting
° IBI between 34 and 32 = Partially supporting
° IBI less than 32 = Not supporting
Criteria for macroinvertebrate community data were unchanged. |
| 2002 | Based on IDEM's adoption of the U.S. EPA's integrated reporting format, the category for partially supporting was eliminated for both fish community data and macroinvertebrate community data:
° IBI greater than or equal to 32 = Fully supporting
° IBI less than 32 = Not supporting
Criteria for macroinvertebrate community data were unchanged. |
| 2004 to 2008 | IDEM completes its first five-year basin monitoring rotation. After reviewing the narrative aquatic life use criteria and definitions of a well-balanced aquatic community in Indiana's water quality standards (327 IAC 2-1 and 327 IAC 2-1.5), IDEM determined that IBI values previously considered partially supporting are reflective of poorer conditions and should be classified as not supporting. The resulting criteria were applied to all basins in Indiana:
° IBI greater than or equal to 36 = Fully supporting
° IBI less than 36 = Not supporting
With a more robust set of macroinvertebrate community data, IDEM was also able to calibrate its criteria for this type of data, developing specific criteria applicable to all basins in the state.
For samples collected with an artificial substrate sampler:
° mIBI greater than or equal to 1.8 = Fully supporting
° mIBI less than 1.8 = Not supporting
For
samples collected using kick methods:
° mIBI greater than or equal to 2.2 = Fully supporting
° mIBI less than 2.2 = Not supporting |
| 2010 to present | Criteria for fish community data remain unchanged.
IDEM developed a new mIBI using mHAB sampling methods that accounts for all habitat types available at a given site and that is applicable in all basins in the state. All samples are collected using a D-frame net, and mIBI scores range from 12-60:
° mIBI greater than or equal to 36 = Fully supporting
° mIBI less than 36 = Not supporting |
FISH CONSUMPTION SUPPORT ASSESSMENTS
The U.S. EPA "generally believes that fish and shellfish consumption advisories . . .based on reach specific information demonstrate impairment of CWA section 101(s) 'fishable' uses" and continues to require that IDEM make water quality assessments for fish consumption and place waters with fish consumption advisories on its 303(d) list of impaired waters (U.S. EPA, 2000a). However, Indiana's WQS do not contain numeric criteria for the concentration of mercury or polychlorinated biphenyls (PCBs) in fish tissue. IDEM's past and present fish consumption use assessments are a translation of the narrative portion of Indiana's WQS, which states that surface waters ". . . shall be free from substances in concentrations that on the basis of available scientific data are believed to be sufficient to injure, be chronically toxic to, or be carcinogenic, mutagenic, or teratogenic to humans, animals, aquatic life, or plants." (
327 IAC 2-1-6(a)(2) and
327 IAC 2-1.5-8(b)(2)).
Mercury
In 2001, the U.S. EPA issued a revised human health-based water quality criterion for methylmercury (U.S. EPA 2001). This criterion was unique among all U.S. EPA (Clean Water Act 304(a)) water quality criteria in that it identifies an acceptable mercury concentration in fish tissue rather than water. A fish tissue criterion is logical because fish are the main source of methylmercury exposure to both humans and wildlife. Also, a tissue-based criterion eliminates the need for a bioaccumulation factor in the criterion calculation, which can be a significant source of uncertainty. The derivation of the methylmercury water quality criterion is based on the reference dose of 0.1 μg/kg body weight/day, exposure data (for example, the amount of methylmercury ingested, inhaled, or absorbed per day), and data about the target population to be protected. The U.S. EPA criterion (U.S. EPA 2001) is 0.3 mg/kg wet weight methylmercury in fish muscle tissue. Since nearly 100 percent of the mercury in fish muscle is methylmercury, the criterion can reasonably be considered a total mercury criterion.
Polychlorinated Biphenyls (PCBs)
The U.S. EPA has not issued a human health-based criterion for PCBs in fish tissue, and Indiana's WQS do not contain a numeric concentration criterion for PCBs in the edible portion of fish tissue. However, Indiana has adopted human health WQS to protect the public from adverse impacts due to:
(1) exposure through public drinking water supplies withdrawn from surface waters; and
(2) nondrinking water exposures, such as consumption of fish caught in Indiana lakes, rivers, and streams.
Although human consumption of sport fish is not explicitly described in Indiana's WQS, fish consumption values are included as part of the calculation of the human health criteria intended to ensure that the levels of a carcinogenic chemical in fish are not at levels harmful to people who consume them.
Without a U.S. EPA criterion derived specifically for fish tissue concentration of PCBs, using the U.S. EPA's methodology for deriving ambient water quality criteria for the protection of human health (U.S. EPA 2000b) to calculate a concentration value for PCBs is a reasonable alternative that results in a criterion that is more readily applicable to Sections 305(b) and 303(d) water quality assessments than using FCA grouping levels. IDEM's benchmark criteria for mercury and PCBs in fish tissue are shown in Table 8.
Table 8: WQS-based assessment thresholds for mercury and PCBs.
| | |
| Mercury (Hg) |
| Concentration in Fish Tissue | Fully Supporting | Not Supporting |
| Less than or equal to 0.3 (mg/kg wet weight) | Greater than 0.3 (mg/kg wet weight) |
| Polychlorinated Biphenyls (PCBs) |
| Concentration in Fish Tissue | Fully Supporting | Not Supporting |
| Less than or equal to 0.02 (mg/kg wet weight) | Greater than 0.02 (mg/kg wet weight) |
Relationship of IDEM's WQS-Based Criteria to the FCA
Fish consumption advisories (FCAs) are determined based on the quantity of a chemical in fish, such as milligrams of chemical per kilogram of the edible portion of fish tissue (mg/kg). WQS, on the other hand, are expressed as the quantity of the chemical in water, such as micrograms of a chemical per liter of water (μg/L). The exposure assumptions upon which the human health criteria are based can be used to calculate a maximum safe fish concentration. That fish concentration value can then be directly compared to the values used to issue fish consumption advisories to determine whether the advisory is less or more protective than the WQS.
The levels of fish tissue contaminants that trigger a FCA and the levels of fish tissue contaminants on which the WQS criteria are based are derived using the same contaminant result, reference dose, and assumptions about the body weight of those consuming the fish. Although the U.S. EPA derived its recommended screening value for a fish advisory limit for mercury and human health methylmercury criterion from virtually identical methodologies, it is important to clarify the distinctions between the two values. They are consistently derived, but, because the two values differ in purpose and scope, they diverge at the risk management level. Fish advisories are intended to inform the public about how much consumers should limit their intake of individual fish species from certain waterbodies. In contrast, the human health criterion is used as the basis for nonregulatory and regulatory decisions. The criterion serves as guidance for use in establishing WQS, which, in turn, serve as a benchmark for attainment, compliance, and enforcement purposes.
FCAs are intended to provide for the protection of human health over a lifetime of exposure, maximizing the benefits of eating fish while minimizing the risk. The calculations used to determine if a FCA should be issued are based on the contaminant concentration found in fish, which is treated as a constant while consumption rates are allowed to vary (how much fish a person can safely consume without exceeding a particular dose rate).
Allowing for different consumption rates makes it possible to safely consume fish that have different levels of contamination. The recommended consumption rate is reduced as fish tissue contaminant concentrations increase. In contrast, WQS criteria calculations start with an assumed level of fish consumption and derive a criterion for a safe level of exposure to the contaminant in the fish for those who consume them. Because the consumption rate is held constant, the resulting criterion can be applied consistently to all waters. FCAs are expressed for a given waterbody in terms of certain species within certain size ranges. Very few FCAs apply to all fish in a given waterbody, which limits their utility for water quality assessment purposes.
IDEM's assessment methodology for evaluating fish tissue data is directly applicable to all waters and uses the revised human health-based water quality criterion for methylmercury (U.S. EPA 2001) and a criterion for PCBs derived from the U.S. EPA's (2000b) human health methodology.
While mindful of the differences in purpose and function of the FCA and the 303(d) list, IDEM's methodology maintains as much consistency as possible between the protocols that ISDH, IDEM, and the Indiana Department of Natural Resources use to assess data for the FCA and the protocols that IDEM uses to assess data for the determination of impairment. For PCBs, the WQS-based threshold is lower than the FCA threshold for a Group 2 advisory. Therefore, there is a concentration range where there could be a WQS exceedance but still unlimited consumption. However, the threshold for mercury is higher than that which would trigger a Group 2 advisory (Table 9). For mercury, given the existing exposure assumptions upon which the water quality criteria are based, issuance of a FCA does not necessarily indicate an exceedance of WQS.
Table 9: Fish tissue concentrations for levels of consumption advice protective of sensitive populations established by ISDH for mercury and total PCBs and its correspondence to an impairment condition as determine by the WQS criteria. Sensitive populations include pregnant or nursing women, women that will become pregnant, and children under 6 years of age.
| | | | | |
| Mercury | Fish Tissue Concentration (mg/kg) |
| Less than 0.05 | 0.05 – 0.2 | 0.2 – 1.0 | 1.0 – 1.9 | Greater than 1.9 |
| FCA Groups | Group 1 | Group 2 | Group 3 | Group 4 | Group 5 |
| Consumption Advice (FCA) | unlimited | 1 meal per week | 1 meal per month | 1 meal every 2 months | No consumption |
| PCBs | Fish Tissue Concentration (mg/kg) |
| Less than 0.05 | 0.05 – 0.2 | 0.2 – 1.0 | 1.0 – 1.9 | Greater than 1.9 |
| FCA Groups | Group 1 | Group 2 | Group 3 | Group 4 | Group 5 |
| Consumption Advice (FCA) | unlimited | 1 meal per week | 1 meal per month | 1 meal every 2 months | No consumption |
*Shaded cells indicate consumption advice that corresponds to nonsupport and an impaired condition using the WQS-based criteria.
The consumption rates expressed in Indiana's WQS for human health are 15.0 g/day for waters in the Great Lakes basin (
327 IAC 2-1.5-14) and 6.5 g/day for downstate waters (
327 IAC 2-1-8.6). For mercury, IDEM defaulted to the U.S. EPA water quality criterion 0.3 mg/kg methylmercury wet weight determined at a consumption rate of 17.5 g/day for mercury in fish tissue and a reference dose of 0.1 μg/kg body weight/day (U.S. EPA, 2001).
For calculating the criterion for PCB in fish tissue, IDEM used the same consumption rate the U.S. EPA used to calculate its criterion for mercury in fish tissue for the general population, which is 17.5 g/day national consumption rate. The use of a higher consumption rate in the PCB calculation is consistent with that used by the U.S. EPA and results in a more protective criterion than applying the consumption rate expressed for either the Great Lakes basin or downstate waters. The same holds true for mercury. IDEM's decision to use the U.S. EPA's criterion value for mercury in fish tissue was a policy decision based on the fact that the U.S. EPA's criterion is more protective. Calculations for both criteria are provided in Attachment C.
Assessment method using the WQS-based criteria
IDEM's assessment methodology for evaluating fish tissue data is summarized in Table 10, and reflects a conservative approach intended to both identify waters in which the data indicate impairment for mercury or PCBs, or both, and to provide for the protection of human health.
Table 10: Water quality assessment methodology for determining fish consumption use support.
| | |
| Fish Consumption Use Support (Human Health) – All Waters |
| Available fish tissue data for the most recent 12 years of data collection are evaluated. Only waters for which sufficient fish tissue data were available were assessed for fish consumption. All results from sampling locations considered representative of a given assessment unit (lake or reservoir; stream or stream reach) must be below the benchmarks for mercury and PCBs in order to be assessed as fully supporting. For mercury, all waters with a trophic level weighted arithmetic mean result (calculated with all the samples collected during the same sampling event) that exceeds the applicable benchmark are classified as impaired. For PCBs, all waters with a single sample result for a given species exceeding the applicable benchmark are classified as impaired. |
| Mercury in Fish Tissue | Fully Supporting | Not Supporting |
| Trophic level weighted arithmetic mean concentration values for all sampling events are less than or equal to 0.3 mg/kg wet weight | Trophic level weighted arithmetic mean concentration values for one or more sampling events are greater than 0.3 mg/kg wet weight |
| PCBs in Fish Tissue | Fully Supporting | Not Supporting |
| Actual concentration values for all samples are less than or equal to 0.02 mg/kg wet weight | Actual concentration values for one or more samples are greater than 0.02 mg/kg wet weight |
For PCBs, all samples from a given sampling reach must have results below the benchmark for PCBs in order to be assessed as fully supporting, and all waters with a sample result exceeding the benchmark are classified as impaired. This is a highly conservative approach that considers only the highest sample PCB concentration, which may be one of a number of samples collected at the site.
For mercury, IDEM calculates a single, trophic level, consumption rate-weighted, arithmetic mean result for the site based on all the samples collected during a given sampling event. This result is then compared to the criteria to determine use support. All waters with a trophic level, consumption rate-weighted, arithmetic mean result exceeding the benchmark are classified as impaired. The calculation IDEM uses provided in Attachment C apportions the national default consumption rate of 17.5 g/day across three trophic levels based on the amount and type of fish (by trophic level) that people might be consuming and, as such, more accurately characterizes human exposure and, therefore, fishable use support.
Sport fish are of particular importance to the question of consumption because they comprise the majority of fish taken by anglers. Most sport fish are predator species but also include omnivores such as carp. Therefore, to properly determine the degree to which a waterbody supports fish consumption, an appropriate methodology takes into consideration both the types of fish being caught and how differences in species affect the concentrations of the contaminant in question.
The differences in IDEM's assessment methods for PCBs and mercury are a function of how these contaminants accumulate in the tissues of fish when the fish ingest them. PCB concentrations in fish are primarily a function of their fat content while mercury concentrations are more a function of their trophic level. Because PCBs accumulate in the fatty tissues of fish, concentrations tend to be higher in more fatty species such as carp and catfish as opposed to species such as bass and sunfish, which are leaner by comparison. In contrast, mercury tends to be higher in predator species because it bioaccumulates up the food chain as larger fish consume smaller fish containing mercury.
The method of calculating a trophic level-weighted, arithmetic mean for mercury is not appropriate for PCBs because trophic levels are less predictive than individual species of PCB concentrations in fish caught at a given site. As a result, trophic levels are less representative of the amount of PCBs a person might consume.
Based on the way that PCBs bioaccumulate in fish tissue (by accumulating in their fatty tissue), IDEM continues to use the results of individual samples for the purposes of assessment, and the type of fish species continues to be a factor in assessment. Based on the U.S. EPA's 2010 guidance, the particular species is no longer as relevant for evaluating total mercury concentration (most of which is methylmercury) in fish tissue, which is more a function of trophic level for determining fish consumption use support. For evaluating mercury in fish tissue, IDEM uses a trophic level, geometric mean to calculate a consumption-weighted, arithmetic mean for the site, which considers consumption levels across all trophic levels and includes all species types. IDEM's process for determining fish consumption use support is described in more detail in the following steps.
Step 1. Determine adequate data for assessment
The adequacy of a data set for the purposes of making a 305(b) assessment is determined by the analytical quality of the data set as well as the amount and age of the data. All of these factors can affect the degree to which the data accurately represent waterbody conditions.
One sampling event is considered sufficient for assessment purposes. At a given sampling event, composite samples are made for each species within a given size class collected at the site, which provides one or more species-specific results for assessment. For PCBs, results for each individual sample are compared to the 0.02 mg/kg criterion to make the assessment. For mercury, a consumption-weighted, arithmetic mean is calculated for each sampling event using the results from all the samples collected. The arithmetic mean result for each sampling event is treated as an individual result and compared to the 0.3 mg/kg criterion. Multiple sampling events within a single year or multiple years for a site are not pooled together for either mercury or PCB assessments.
U.S. EPA guidance suggests that, while all readily available data should be reviewed, 305(b) assessment decisions should be based on data five or fewer years old. However, IDEM has established 12 years as the appropriate index period for the purposes of evaluating fish tissue data. Given the persistent nature of fish tissue contaminants in the environment, aggregating data over several years minimizes the effects of temporal, spatial, and species-level variability on the assessment process. Based on IDEM's sampling strategy, an index period of 12 years ensures two full cycles of fish tissue data for use in evaluating fish consumption use support.
Each contaminant is assessed independently. Therefore, the use is considered impaired, and the waterbody is listed if either mercury or PCBs in fish tissue fails to meet the corresponding benchmark for full support.
Independent applicability is also applied to all results obtained within the index period for assessment. By definition, the index period is the period of time over which the data may reasonably be considered representative of conditions in a given waterbody. A single, older result collected within the index period may well be representative of the variability within the waterbody and is considered equally valid as any other sample collected in the same index period.
Therefore, where there are conflicting results from samples collected within the index period, the waterbody is assessed as impaired regardless of when in the index period the exceeding results were collected and even if the more recent results indicate full support.
Step 2: Apply WQS-based concentration thresholds to determine use support
The WQS-based assessment thresholds shown in Table 8 were applied to all lakes and streams for which sufficient fish tissue data were available. IDEM's methods for applying these criteria are summarized in Table 10. All waters found to be not supporting due to either mercury or PCBs, or both, are categorized as impaired and placed in Category 5B of Indiana 303(d) List of Impaired Waters.
Step 3: Determine the appropriate geographical extent to which the assessment applies
In some cases, fish can be very mobile and difficult to attribute to a discrete portion of a lake or river reach. In determining the appropriate geographical extent to which results can be confidently applied, IDEM follows the general rules described below. Unless otherwise stated, the same general rules are applied to assessments of both PCBs and mercury in fish tissue.
Stream Order Considerations
For flowing waters, stream order is the primary factor considered in determining the appropriate distance over which the results should be applied. Stream order is a good indicator of relative stream size, and, to the extent that size affects flow, the size of a given stream has a significant effect on species and sizes of fish that might be caught there.
Generally, in cases where significant differences in stream order exist in a given watershed, results are applied only to the stream on which they were obtained. This is because the fish community found in a third or fourth order stream might reasonably be expected to be very different from the fish communities found in its first and second order tributaries. Likewise, the expectations for the type and sizes of fish found in a fifth order stream would be different from those for a third or fourth order stream. Given this, results obtained from fifth order and greater streams are limited only to the mainstem and are not considered representative of their tributaries. Because of the significant effects that stream order has on the structure of the fish community in a given stream, basing extrapolations primarily on stream order allows us to more reliably apply fish tissue results on a stream-specific basis.
Most of Indiana's larger streams and rivers (third, fourth, and fifth order streams) have been monitored for many years, resulting in very robust data sets. On these streams, results are applied to greater lengths where upstream and downstream samples were available.
Results for many of Indiana's smaller streams (first and second order streams) are generally more limited. On these waters, results are applied only to the 12-digit watershed boundary except in cases where additional results from sites in an upstream or downstream watershed support assessment over a greater distance. In these cases, assessments are limited to mainstem reaches between the sites and are not applied to their tributaries. Results from a mainstem site are also applied to its headwaters if obtained in the same watershed or the watershed immediately downstream.
The Consideration of Background Conditions in Assessments
For PCBs, relative concentrations are used as an indicator of background conditions. Values greater than 1,000 ppb for PCBs are considered suggestive of point sources, most of which are known legacy sources of this contaminant. Values lower than this can be reasonably attributed to atmospheric and biological redistribution of contaminants or low level nonpoint sources and are considered representative of background conditions. Therefore, for PCBs, monitoring results in a smaller watershed are also extrapolated into other streams of similar stream order in that watershed when values are consistently low such as to suggest background conditions. In cases where the sampling site is located in a particularly large or hydrologically-complex watershed or far upstream from most or all streams in the watershed, extrapolations are more limited. Extrapolations around sites with very high PCB concentrations suggesting point sources are also limited.
Atmospheric deposition from local and regional sources is the primary cause of mercury in waterbodies. While mercury is a naturally occurring element in the environment, scientific evidence suggests that human activities may be increasing the levels of mercury released into the atmosphere (Risch and Fredericksen, 2015).
Unlike PCBs, there is no concentration value for mercury that is considered particularly suggestive of point sources. High mercury values in fish tissue are more indicative of localized methylation processes affecting the amount of mercury available for uptake than any sources of contamination. Background conditions for mercury in fish tissue are very difficult to determine because they are highly dependent on the structure of the fish community, which differs significantly depending on the size of the stream in question. While it may be possible to predict background conditions for a given stream order to guide extrapolations of results for mercury in fish tissue, stream order itself remains a more reliable indicator of the extent to which those results may be representative for the purpose of determining use support.
Additional Factors Considered When Evaluating Results from Lake Samples
All fish tissue data are aggregated for a given lake or reservoir unless there is evidence that fish caught from certain parts of the lake were isolated and may have been exposed to a different level of contamination.
Fish community structure within a lake can clearly influence the fish community structure for some distance in streams flowing from lakes. Given this, results from lakes and reservoirs are applied downstream into adjacent watersheds in cases where there are downstream data to support the assessment. In cases where there are no data available for out-flowing streams, results for lake samples are applied only to the lake from which they are collected.
RECREATIONAL USE ASSESSMENTS
For streams, IDEM applies the decision making process shown in Table 11 where data minimums for recreational use assessments in Table 2 are met. For lakes, IDEM conducts two types of assessments to determine the extent to which Indiana lakes and reservoirs support recreational uses. Where there are available bacteria data, IDEM assesses recreational use support within the context of human health in the same manner as it does with streams (Table 11). IDEM also evaluates the degree to which Indiana's lakes and reservoirs support recreational use within the context of aesthetics. The types of data used in these assessments and the required data minimums are shown in Table 2. The assessment process is described in Table 13 and explained in more detail in this section.
Table 11: Methods used to assess Indiana waters for recreational use support within the context of human health.
| | |
| Recreational Use Support (Human Health) – All Waters |
| IDEM has two different methods for determining recreational use support, depending on the type of data set being used in making the assessment. For data sets consisting of five equally-spaced samples over a 30-day period, IDEM applies two tests, both of which are based on the U.S. EPA's Ambient Water Quality Criteria for Bacteria - 1986 (U.S. EPA, 1986), which provides the foundation for Indiana's WQS for recreational use. For data sets with 10 or more grab samples but without the five samples equally-spaced over the 30 days required to calculate a geometric mean, the 10% rule is applied. When both types of data sets are available, the assessment decision is based on the data set consisting of five samples, equally-spaced over a 30-day period during the recreational season as defined in Indiana's WQS (April 1 to October 31). |
| Bacteria (E. coli): at least five equally-spaced samples over 30 days. (cfu = colony forming units) | Fully Supporting | Not Supporting |
| Geometric mean does not exceed 125 cfu/100mL | Geometric mean exceeds 125 cfu/100mL. |
| Bacteria (E. coli): grab samples (cfu = colony forming units) | Not more than 10% of measurements are greater than 576 cfu/100mL (for waters infrequently used for full body contact) or 235 cfu/100mL (for bathing beaches)10.
And
Not more than one sample is greater than 2,400 cfu/100mL. | More than 10% of samples are greater than 576 cfu/100mL or more than one sample is greater than 2,400 cfu/100mL. |
On a national scale, the number one impairment of lakes and reservoirs has long been identified as nutrients. Prior to 2008, IDEM's lakes assessments were largely limited to CWA Section 314 assessments of lake trends and trophic state, due in part to the absence of numeric water quality criteria for nutrients in the state's WQS. Indiana's WQS do contain narrative criteria applicable to all waters of the state. However, developing an assessment methodology that translates narrative criteria in a scientifically defensible way remains a challenge for states.
In 2008, IDEM developed an assessment method for determining the degree to which nutrient enrichment may be impacting the aesthetic value of Indiana lakes and their use for recreational activities, which is based on benchmark values for total phosphorus (TP) and chlorophyll a(CHL) developed by Limno-Tech, Inc. (LTI) (Table 13).
Table 12: Recommended phosphorus thresholds and their corresponding expected ranges of chlorophyll-a concentrations.
| | |
| Lake Type | TP (μg/L) | Associated Range in CHL (μg/L) |
| Natural Lakes | 54 | 4 to 20 |
| Reservoirs | 51 | 2 to 25 |
Source: Modified from LTI (2007).
The associated range of CHL represents the range of concentrations expected when TP concentrations are at or below 54 μg/L for natural lakes or 51 μg/L for reservoirs, respectively. In some cases, the CHL results are not consistent with the expectations shown in Table 13 based on the TP levels measured for a given lake (for example, low CHL values associated with high TP values or vice versa). For these situations, IDEM's methodology uses the trophic state index (TSI) score as a surrogate response variable (in addition to CHL) to determine impairment status.
While the TSI does not provide a direct response variable for TP, it can be a useful indicator in cases where CHL results are mixed. In addition to providing a surrogate measure for CHL, the TSI score also provides a good measure of the overall trophic condition of a given lake. Recognizing the connection between trophic status and nutrient enrichment, the U.S. EPA generally considers hypereutrophic conditions as measured by the TSI indicative of impairment (U.S. EPA, 2000c).
IDEM does not believe that the TSI score alone is sufficient information for making designated use assessments because it can be affected by a number of variables in addition to nutrient loading, such as levels of non-algal turbidity or factors that may be limiting algal growth. However, in cases where the CHL and TP results are mixed, IDEM uses the most recent TSI score to determine impairment. If the TSI score indicates eutrophic or hypereutrophic conditions, the lake is assessed as impaired. TSI scores are not used in the absence of CHL results and are only reviewed in cases where there are sufficient TP and CHL data, but those data showed conflicting results.
These threshold values are applied as benchmarks for the purposes of determining recreational use support of Indiana's natural lakes and reservoirs within the context of aesthetics in the following manner:
Step 1. Determine the available data to be used for assessment
Indiana's Clean Lake Program (CLP) samples between 70 and 80 lakes each year selected from a randomized list of all public lakes and reservoirs in the state that have a usable boat ramp and are larger than five acres. Lakes are monitored from July through August, which is the time of year when worst-case scenarios and stable conditions (warm temperatures, thermal stratification, hypolimnetic anoxia, and algal blooms) are expected.
All available data for a given lake were used for assessment purposes. U.S. EPA guidance suggests that, while all readily available data should be reviewed, 305(b) assessment decisions should be based on data that is five or fewer years old. The use of historical data is necessary because the sampling conducted by IDEM's CLP program is designed specifically to support CWA Section 314 assessments of trophic state and lake trends but not to make designated use assessments. As a result, while Indiana's CLP sampling strategy ensures sufficient samples for determining trophic state and trends, it does not guarantee sufficient data for making designated use assessments (see Table 2 for minimum data requirements). To date, most CWA 305(b) assessments rely on the following CLP data sets:
• One-time samples collected from public access lakes by students at Indiana University's School of Public and Environmental Affairs and analyzed in the CLP's laboratory.
• Monthly TP and CHL samples collected from public and private lakes by trained volunteers and sent to the CLP's laboratory for analysis.
Step 2. Determine adequate data for assessment
For purposes of determining recreational use support within the context of aesthetics, the following general rules were applied:
• Only TP and CHL data, including volunteer-collected data, analyzed in the CLP's laboratory in accordance with the CLP Quality Assurance Project Plan were used for assessment purposes.
• A minimum of three years' worth of data was considered sufficient for assessment purposes as long as each TP value had a corresponding CHL value.
• Multiple results within a given year for TP and CHL were averaged to provide a single value for each parameter for that year.
• For consistency in assessments, all samples used in attainment decisions must have been collected during the summer season.
Step 3: Apply benchmark criteria to determine use support
The TP and CHL thresholds shown in Table 12 were applied to all natural lakes and reservoirs for which sufficient data were available. IDEM's methods for applying these criteria are summarized in Table 13 and are illustrated in Figure 2. All waters found to be not supporting of recreational use (aesthetics) were categorized as impaired and placed in Category 5A of Indiana's 303(d) List of Impaired Waters.
Given the robust, Indiana-specific dataset upon which the thresholds recommended in the Limno-Tech, Inc. (LTI) study were developed, IDEM believes them to be appropriate for making designated use assessments.
Table 13: Methods used to assess Indiana lakes and reservoirs for recreational use support within the context of aesthetics.
| | |
| Recreational Use Support (Aesthetics) – Lakes and Reservoirs |
| Natural Lakes | Fully Supporting | Not Supporting |
| Not more than 10% of all TP values greater than 54 μg/L and their associated (CHL) values are less than or equal to 20 μg/L | Less than 10% of all TP values are greater than 54 μg/L but their associated CHL values are greater than 20 μg/L, and the CHL trophic state index (TSI) score for the lake indicates eutrophic (50-70) or hypereutrophic (greater than 70) conditions
Or
More than 10% of TP values are greater than 54 μg/L with associated CHL values less than 4 μg/L, but the TSI (CHL) score for the lake indicates eutrophic (50-70) or hypereutrophic (greater than 70) conditions
Or
More than 10% of all TP values are greater than 54 μg/L with associated CHL values greater than 4 μg/L |
| Reservoirs | Fully Supporting | Not Supporting |
| Not more than 10% of all TP values greater than 51 μg/L and their associated CHL values are less than 25 μg/L | Less than 10% of all TP values are greater than 51 μg/L but their associated CHL values are greater than 25 μg/L and the TSI (CHL) score for the lake indicates eutrophic (50-70) or hypereutrophic (greater than 70) conditions
Or
More than 10% of all TP values are greater than 51 μg/L with associated CHL values less than 2 μg/L, but the TSI (CHL) score for the lake indicates eutrophic (50-70) or hypereutrophic (greater than 70) conditions
Or
More than 10% of all TP values are greater than 51 μg/L with associated CHL values greater than 2 μg/L |
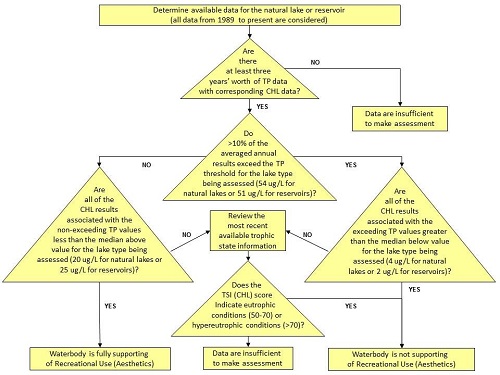
Figure 2: IDEM's assessment process for determining recreational use support for lakes within the context of aesthetics (TP = Total Phosphorus; CHL = Chlorophyll a; TSI = Trophic State Index).
PUBLIC WATER SUPPLY USE ASSESSMENTS
From 2002 to 2016, IDEM's methods for determining support of the public water supply (PWS) use changed very little. In 2015, IDEM convened an internal work group to develop a more comprehensive methodology for assessing waters designated as source waters for public water supplies. The result of this effort was a significant revision to IDEM's previous methods, which were first published for public review and comment on April 6, 2016 (IDEM, 2016), and became effective with the 2018 Integrated Reporting cycle.
IDEM's revised methods for PWS use assessments build on the water quality criteria in Indiana's WQS and other benchmarks intended to protect the quality of source water prior to its withdrawal and treatment by drinking water facilities. These methods describe:
• The type of waterbodies to be assessed and the geographical extent to which the assessment will apply.
• The indicator(s) to be used in the assessment decision and the period of record during which water quality monitoring results and other information are considered representative for assessment purposes.11
• Minimum water quality data and other information required for assessment including the minimum number of monitoring results necessary for the decision and any sampling frequency or seasonality requirements, or both.
• The applicable water quality criteria or other benchmarks, or both, and the number of exceedances allowed.
Waterbodies Designated for Public Water Supply Use
Unlike most other designated uses, which apply to all waters of the state, the public water supply use is very narrowly defined in Indiana's WQS. The water quality criteria specific to PWS were established to protect the surface water quality at the intake, which is the point at which the water is withdrawn for treatment. Drinking water provided by PWS facilities is regulated by the Safe Drinking Water Act (SDWA) with the use of maximum contaminant levels (MCLs), which apply to water after it has been withdrawn and treated for human consumption. A comparison of the water quality criteria and benchmarks IDEM uses for its CWA assessments and SDWA MCLs can be found in Attachment D.
IDEM's previous and current methodology designates any waterbody with an active12 surface water intake as a source water for the purposes of making CWA 305(b) assessments and 303(d) listing decisions. However, the revision to the methodology expands the definition of a source water to include surface waters with intakes for emergency water supplies and those waters that have been determined to have a direct influence on a public water supply well. Although intakes for emergency water supplies are not regularly used for source water, they may be placed into service if needed and, thus, should carry the same designation as other source waters.
IDEM has also identified five public ground water supply systems that are under the direct influence of surface waters. While the surface waters influencing these systems are not themselves used as source waters, IDEM has designated them as such based on their potential to transport contaminants into the groundwater supplying these systems. If and when IDEM identifies additional surface waters with the potential to directly influence a public water supply well, they will be designated for the public water supply use and assessed in the manner described in this methodology.
Inland Lakes and Streams
For inland lakes and streams, IDEM's methods for defining assessment units for PWS are based on the approach described in Indiana's Source Water Assessment Plan (SWAP) (IDEM, 2000) for developing source water assessments (SWAs) required under the federal SDWA for public water supplies that rely on surface water as part or all of their supply. This approach includes an evaluation of susceptibility, which is the potential for a PWS intake to draw in surface water with contaminant concentrations that would cause concern for water utility operators or the consumer (IDEM, 2000).
According to the SWAP, susceptibility may be represented as a series of "zones" for the purposes of developing contingency plans and to prepare for emergency response. The zones in which contamination has the potential to create a water supply emergency or have otherwise adverse effects within a matter of hours or days are those in close proximity to the intake.
While these zones are not intended to support water quality assessments for the purposes of CWA 305(b) assessments, their use for assessments is in keeping with the water quality criteria in Indiana's WQS, which were "established to protect the surface water quality at the point at which water is withdrawn for treatment for public supply."
Inland lakes and reservoirs are treated as individual assessment units for the purposes of PWS assessments, regardless of where in the waterbody an intake is located. This is consistent with Indiana's SWAP in which susceptibility zones are defined around the entire perimeter of the lake. This approach assumes that contaminants introduced anywhere in the lake have the potential to impact the quality of the water withdrawn at the intake and, therefore, provides a representative unit of assessment for the purposes of determining designated use support.
For all streams, including the Ohio River, IDEM has defined assessment units for each intake based on the "Emergency Management Zone", which begins at the point of surface water withdrawal at the intake to 1,000 feet upstream. The assessment units in the Indiana Reach Index, on which surface water intakes are located, are currently much larger than 1,000 feet and will need to be re-indexed to accommodate these more narrowly applied assessments.
Lake Michigan
IDEM's PWS use assessments for Lake Michigan will apply only to the areas in which source waters are withdrawn within Indiana's state boundary. For the purposes of determining support of PWS use in Lake Michigan, IDEM has defined its assessment units based on the "Immediate Nearshore Area" (INA) as defined in Indiana's SWAP. The INA is all the land within 1,000 feet of the shoreline extending 0.5 mile on either side of where the intake pipe intersects the shoreline area. This is the area that has the greatest potential for contaminants coming from the shoreline to have adverse effects on the PWS within a matter of hours or days. Therefore, the lateral distance of each assessment unit will be limited to the INA and extend from the outer boundary of the nearshore area13 to the Indiana border, which lies in the offshore waters of Lake Michigan (Figure 3).
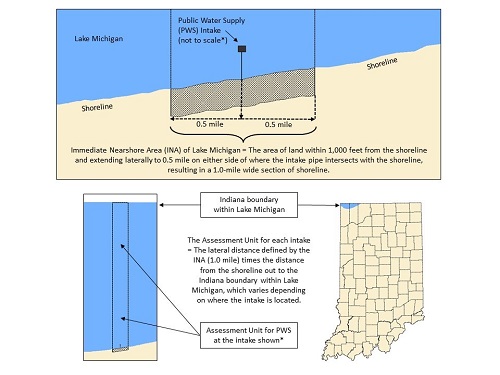
Figure 3: Definition of Lake Michigan assessment units for the purposes of determining PWS use support.
*The source water intake shown is for illustration purposes only and does not represent any specific intake on Lake Michigan.
Surface Waters with a Direct Influence on a Public Water Supply Well
To date, IDEM has identified five public water supply systems with one or more wells that are under the direct influence of surface water. All of these wells belong to community public water supply systems, which are public water systems that provide water for human consumption to at least 15 service connections used by year-round residents or that regularly serve at least 25 year-round residents (for example, municipalities, subdivisions, and mobile home parks). IDEM expects to identify additional public water supply wells and possibly some nontransient, noncommunity system wells that are under the direct influence of surface water in the future. Nontransient, noncommunity systems are public water supply systems that serve at least 25 of the same people more than six months per year (for example, schools, factories, industrial parks, office buildings, etc.).
For any public water supply system well under the direct influence of surface waters, it is possible that pollutants in surface waters located within the well field can reach the well through infiltration, absorption into the soil, or conduits, such as field tiles or water distribution piping that intercepts sandy soils. Specific sources of contaminants vary based on location but can include agricultural chemicals and nonpoint source runoff from roads and highways.
The geographic extent of surface water influence has been modeled in the Wellhead Protection Plans for those community public water supply systems with areas known to be susceptible to surface water. For the purposes of PWS use support assessments, any surface water within the modeled area of influence will be designated as a PWS.
Nontransient, noncommunity public water systems are not required to complete a Wellhead Protection Plan. When a nontransient, noncommunity public water system well is found to be under the direct influence of surface water, IDEM will require the system to complete a Source Water Assessment, which will define a 3,000-foot radius of concern around the well. For the purposes of PWS use support assessments, any surface water within the 3,000-foot radius of concern will be designated as a PWS.
Water Quality Indicators for Determining Support of Public Water Supply Use
Indicators used in the assessment of use support for PWS include:
• Any substances for which numeric criteria for human health apply at the point of water intake that have been identified in Indiana's Water Quality Standards
14 located in Table 6-1 of
327 IAC 2-1-6 and Table 8-3 of
327 IAC 2-1.5-8.
• Any substances for which numeric criteria are defined specifically for the public water supply use15 with the exception of total coliform bacteria for which Level 1 and Level 2 Assessments under the federal SDWA Revised Total Coliform Rule (RTCR) are used.
• The cyanobacterial toxins Cylindrospermopsin and Microcystin-LR for which U.S. EPA has issued drinking water health advisory values.
Water Quality Criteria and Other Benchmarks for Assessing Support of PWS Use
Human Health Criteria Applicable at the Point of Intake and Other Water Quality Criteria Specific to the PWS Use
Indiana's WQS contain human health criteria for several substances applicable at the point of intake in order to protect the public from negative health effects that could occur if they are found in high concentrations in source waters.
For waters in the Great Lakes basin, IDEM will apply the most stringent of the Human Noncancer Criterion (HNC) or the Human Cancer Criterion (HCC) defined for drinking water in Table 8-3 of Indiana's WQS.
For waters outside the Great Lakes basin, IDEM will apply the continuous criterion concentration (CCC) values shown in Table 6-1 of Indiana's WQS at the point of water intake, which represents the most stringent human health criterion for a given substance and is, thus, the most protective of the PWS use.
Indiana's WQS contain numeric criteria specifically for waters designated as source waters for PWS, which like human health criteria, are applicable at the point of intake16. The WQS also include the following criteria to prevent taste and odor issues and to protect human health:
• Dissolved solids (750 mg/l) (or 1,200 micromhos specific conductance as a surrogate)
• Nitrogen, measured as the sum of nitrate and nitrite (10 mg/l)
The criteria for chloride, sulfate, and dissolved solids are intended to prevent taste and odor issues. The criteria for nitrite and nitrogen are intended to protect human health.
IDEM will apply these criteria to data sets meeting the minimum data requirements identified in Table 2 and that were collected from waters designated for PWS in accordance with this methodology.
Indiana's WQS also contain numeric criteria for total coliform bacteria for waters designated as source waters for PWS and that are also applicable at the point of intake17. However, because exceedances of these criteria in source waters do not prohibit or otherwise limit the use of those waters for PWS, IDEM, instead, bases its assessment methodology for bacteria in source waters on the federal SDWA RTCR (U.S. EPA, 2013b). The RTCR went into effect in Indiana on April 1, 2016, replacing the Total Coliform Rule which had been in effect since 1989. Under the previous rule, there was no systematic way to determine when MCL violations for bacteria were attributable to source water issues. The RTCR now provides a means of identifying public water supplies adversely impacted by bacterial contamination in source waters and, as such, provides greater opportunity for their protection through IDEM's CWA programs.
The RTCR is intended primarily to ensure the integrity of the drinking water distribution system. However, the Level 1 and Level 2 Assessments, which are required in cases where bacteria are detected in treated water, requires an examination of source waters in addition to the investigation of other factors18. Therefore, the results of Level 1 and 2 assessments conducted under the RTCR will reveal those situations in which MCL violations for bacteria are attributable to source water contamination as opposed to issues within the treatment plant or its distribution system, or both.
Although all PWS are required to sample for bacteria, bacterial contamination in source water is primarily a concern for facilities that draw their supplies from surface water, which is vulnerable to far more sources of fecal contamination than ground water. PWS wells under the direct influence of surface water are also somewhat vulnerable to bacterial contamination. However, bacteria can be effectively removed with conventional PWS treatment, specifically, the disinfection portion of the treatment process, which is required for all surface water systems. Therefore, it is rarely the case that MCL violations for bacteria in treated water are the result of excessive bacterial concentrations in source water19.
By using RTCR assessment results instead of applying a numeric criterion, IDEM's PWS methodology balances the possibility that bacterial contamination in a source water might impair its designated use (by prohibiting or otherwise limiting its use for PWS) with the greater likelihood that MCL violations for bacteria (indicators of potential impairment) are attributable solely to issues within the treatment plant or its distribution system, or both. Using the RTCR ensures that IDEM's assessments:
• Identify those rare cases in which bacterial contamination in source water is limiting or prohibiting the use of an otherwise treatable supply or driving a need for additional treatment beyond conventional treatment methods.
• Do not assess source waters as impaired based on MCL violations attributable to problems within the facility or its distribution system, or both. This may include issues for which other regulatory means already exist to provide a remedy under the SDWA.
A facility that has completed an assessment pursuant to the RTCR and has found a problem to be attributable to bacterial contamination in the source water will assess that source water as impaired. If such an assessment is conducted and the problem is found to be the result of issues within the facility or distribution system, the source waters will be assessed as fully supporting of PWS use. In the absence of any RTCR assessments, the waterbody will remain not assessed for PWS.
Benchmarks Used to Assess for Cyanobacterial Toxins
Algae are a common component of aquatic ecosystems and are commonly found in Indiana lakes and streams. However, the concentrated presence of blue-green algae (cyanobacteria) can be linked to some adverse health effects, and, as a result, cyanobacterial toxins are a growing concern for drinking water facilities. It should be noted that not all blue-green algal blooms produce toxins, and the specific conditions that lead to cyanobacterial toxin production are not well understood in the scientific community.
The SDWA requires water treatment facilities to notify the public when they detect a health risk in treated drinking water supplies. IDEM considers any consumption and use notification issued by a water treatment facility based on cyanobacterial toxin concentrations in treated drinking water to be indicative of source water impairment.
There are no U.S. federal water quality numeric criteria or regulations for cyanobacteria or cyanobacterial toxins in drinking water under the SDWA or for ambient waters under the CWA. Indiana's WQS, likewise, contain no numeric criteria for these substances. However, they do contain narrative criteria intended to protect surface water quality, including those waters designated as a PWS. These criteria state that all Indiana surface waters shall be "free from substances in concentrations that on the basis of available scientific data are believed to be sufficient to injure, be chronically toxic to, or be carcinogenic, mutagenic or teratogenic to humans. . ."20
In the absence of state or federal numeric criteria for cyanobacteria or cyanobacterial toxins, IDEM considers the following benchmarks provided in U.S. EPA's drinking water 10-day health advisories defensible for use in assessments based on Indiana's narrative water quality criteria (U.S. EPA, 2015b and 2015c):
• Cylindrospermopsin concentrations greater than 0.7 micrograms per liter (μg/L).
• Total Microcystin concentrations greater than 0.3 μg/L (using Microcystin-LR, one of the most potent forms of the toxin, as a surrogate).
Cyanobacterial blooms are seasonal in nature with most occurring in later summer. However, high concentrations of cyanobacterial toxins have been found to occur even in colder months. Therefore, IDEM applies these benchmarks to data collected at any time of the year. The occurrence of cyanobacterial toxins in treated drinking water depends on their levels in the raw source water and the effectiveness of treatment methods for removing cyanobacteria and cyanobacterial toxins during the treatment process.
U.S. EPA's Health Advisory values were developed to protect the public from exposure to cyanobacterial toxins in treated drinking water rather than in source waters. For this reason, using these values as benchmarks for the assessment of untreated source waters is conservative in nature, and, based on the idea that if source waters meet these benchmarks, drinking water treatment plants can be reasonably confident that their treatment processes will result in concentrations that are below those that might result in adverse health effects.
However, IDEM's CWA 305(b) and 303(d) assessment and listing processes should not be construed as a public health advisory because they do not reflect conditions in real time. U.S. EPA's health advisories for cyanobacterial toxins are intended to guide treatment decisions when the risk of cyanobacterial toxin contamination is high.
It is important to emphasize that the public cannot assume that, because a particular waterbody appears on the 303(d) list for a cyanobacterial toxin impairment, the treated water they draw from the tap is in any way unsafe to drink. The 303(d) list identifies waterbodies that are not fully supporting their designated uses, but the list is not intended to provide the public with information regarding the quality of the treated drinking water they get from a PWS.
While mindful of the differences in purpose and function of U.S. EPA's health advisories and CWA requirements to determine the degree to which our surface water resources are supporting their use as a PWS, IDEM believes that applying U.S. EPA's Health Advisory numbers as benchmarks provides for greater protection of source waters. Many of the same practices that can help to control taste and odor issues, which are often driven by nutrient enrichment, can also help to reduce the occurrence of algal blooms in surface waters. Where sufficient data are available, applying these benchmarks will help to identify those source waters that are more susceptible to cyanobacterial toxins and prioritize them for further evaluation for CWA Sections 303(d) and 305(b) purposes.
Minimum Data Requirements for Assessment
All available water quality data meeting IDEM's data quality requirements, whether collected by IDEM or external parties, will be used for assessment. U.S. EPA guidance suggests that, while all readily available data should be reviewed, 305(b) assessment decisions should be based on data that is five or fewer years old. For bacteria, all Level 1 and Level 2 Assessments performed in accordance with the RTCR within the most recent five consecutive years will be considered valid for the purposes of designated use assessments of PWS.
Table 2 provides minimum data requirements for assessments of PWS use support along with any corresponding requirements regarding timing and frequency of data collection activities.
For each AU with sufficient data to make one or more designated use assessments, IDEM applies the 305(b) assessment process described in Table 2. The specific criteria or benchmarks to be applied to the data will depend, in some cases, on the location of the waterbody from which they were collected. Assessment data are integrated for the purposes of making water quality assessments, which means that all data for a given waterbody are considered together and each type of data are treated as independently applicable.
Obtaining the Data Needed for Assessment
The PWS use is unlike other designated uses in that it is very narrowly defined in Indiana's WQS. Given the limited size of the AUs defined and designated for PWS, IDEM has very little existing data in its own database or from other sources to use for assessments with this methodology. IDEM is working to remedy that with the development of a monitoring strategy that is expected to provide usable data for assessments.
In 2016, in collaboration with 22 of Indiana's 33 PWS facilities that have surface water intakes, IDEM began working on a pilot project to monitor for several parameters that are expected to provide data for potential use in IDEM's PWS assessments. The project began as an effort to better understand the potential impacts that algae and cyanobacteria in source water have on the ability of PWS facilities to adequately treat the water for human consumption and to inform future treatment options if concentrations ever reach levels requiring additional methods beyond the conventional measures currently in place.
For this project, samples are collected by each facility from within the facility at its raw water intake, and treated water samples are collected on the same day. IDEM provides the sample bottles and shipping labels to the facilities and pays for them to ship the samples on ice to a laboratory selected by IDEM. IDEM also pays for the analytical costs. Samples are analyzed for a number of parameters that may yield data suitable for IDEM's PWS assessments, including:
• Nitrogen, as nitrate + nitrite
• Cylindrospermopsin and Microcystin
IDEM continues to work on building collaborative partnerships with drinking water facilities and other interested parties to collect the high quality data needed to support assessments in the future. IDEM will also explore the feasibility of expanding its own monitoring program to provide water quality data for assessment and continues to seek additional sources of existing data at or near surface water intakes.
CWA SECTION 314 ASSESSMENTS OF INDIANA'S LAKES AND RESERVOIRS
In addition to IDEM's CWA Section 305(b) assessments for fish consumption, recreational use, and PWS, IDEM also conducts trend and trophic state assessments of Indiana lakes and reservoirs. These assessments are made to satisfy the requirements of CWA Section 314, which requires states to report on the trophic status and trends of all publicly owned lakes in Indiana. Most of the data used in these assessments comes from the Indiana Clean Lakes Program (CLP).
The CLP samples approximately 80 lakes each year in July and August, which is the time of year when worst-case scenarios and stable conditions (warm temperatures, thermal stratification, hypolimnetic anoxia, and algal blooms) are expected.
Prior to 2010, lakes were selected for sampling based on logistical considerations to minimize travel costs. With 401 public lakes in the state, this strategy ensured that most lakes would be monitored once every five years. While these results can be applied to individual lakes, they were regionally restricted and could not be used to make statistical inferences about the trophic conditions of lakes on a statewide basis.
In 2010 and in consultation with IDEM, the CLP began using a randomized approach to select lakes for sampling in order to support a statewide assessment of trophic condition of Indiana lakes. Now, at the beginning of each sampling season, the CLP randomizes its list of public lakes and selects the first 80 on the resulting list to be monitored that season. Each season, the list is re-randomized. Using this approach, it is no longer a given that all 401 of Indiana's public lakes will be monitored in five years. However, the data collected now provides statistically significant results that can be applied to the entire state. These results are published every two years in the CLP's Indiana Lake Water Quality Assessment Report, which is available online at: http://www.indiana.edu/~clp/PUBreports.php.
The CLP also made changes to its sampling and analytical methods for phytoplankton, which in turn required changes in the methods IDEM uses to determine the trophic status of individual lakes and reservoirs. These changes, which are discussed in more detail in the following section, impact both IDEM's CWA Section 314 assessments and, to a lesser degree, its CWA Section 305(b) assessments.
Prior to 2010, IDEM used the Indiana State Trophic Index (ISTI) to determine the trophic status and trends in individual lakes throughout Indiana using data collected for the most part by the CLP. In 2010, the CLP made the following changes in its sampling and analytical methods for phytoplankton samples:
• Sample Collection – The CLP switched from using a 63-micron vertical tow net, which captures plankton in the water column greater than 63-microns in size, to an integrated sampler, which captures all the plankton in the water column, resulting in a more representative sample.
• Sample Analysis – The CLP changed its methods for counting plankton from natural units per liter (NU/L) to the number of cells per milliliter (cells/ml). NU/L represents a single organism, which may be a single-celled or multi-celled colonial form. Cell density measured as cells/ml is now preferred among phycologists and limnologists today because it represents the total number of phytoplankton cells including those aggregated in multi-celled colonies.
These changes eliminated some of the indicators required to calculate the ISTI. After the first season in which they were implemented, the CLP performed an analysis to determine whether plankton results expressed in cells/ml could be converted to NU/L for the purposes of calculating the ISTI. The CLP found no clear statistical relationship between the results produced by the two methods that would allow such conversion. Given this, future ISTI scores calculated with plankton data collected and analyzed with the new protocols would generate substantially different results not comparable with previous data. Comparability over time is necessary because IDEM also uses trophic scores to determine lake trends for the purposes of CWA Section 314. In order to ensure comparability, IDEM decided to abandon the use of the ISTI in favor of Carlson's TSI (Carlson, 1977) to determine the trophic condition of Indiana lakes and reservoirs.
IDEM now uses Carlson's TSI exclusively in its CWA Section 314 assessment to determine trophic status and trends for individual lakes. IDEM's CWA Section 305(b) assessment methods for lakes, which are discussed in a later section of this methodology, also rely in part on the Carlson's TSI scores. IDEM's addendum to its 2016 Integrated Report provides the most recent Carlson TSI scores for all lakes for which sufficient data exist to calculate them.
Trophic State Assessments
As noted in the previous section, IDEM now uses the Carlson Index to calculate TSI scores for Indiana lakes. The Carlson TSI score is a measure of algal biomass that can be calculated for three variables, all of which can be used as independent indicators of the amount of algal biomass present in the waterbody. This is the trophic state of the lake or reservoir in question.
The three indicators used are Secchi depth (SD), total phosphorus (TP), and Chlorophyll-a(CHL). The TSI is a scale of 0-100 based on the interrelationships of these three variables using data from northern temperate lakes in North America. The equations used to calculate the Carlson TSI are:
| | |
| | TSI (SD) = 60 – 14.41 ln(SD) | Equation 1 |
| | TSI (CHL) = 9.81 ln(CHL) + 30.6 | Equation 2 |
| | TSI (TP) = 14.42 ln(TP) + 4.15 | Equation 3 |
Theoretically, each TSI score should independently tell the same "story" about the trophic state of a given lake. However, often they do not. This is because not all the assumptions used in the development of the Carlson Index hold true for Indiana lakes.
The index assumes that suspended particulate matter in the water controls transparency (Secchi depth) and that algal biomass is a major source of particulates. However, many Indiana lakes are affected by non-algal turbidity, which can heavily influence transparency. The index also assumes that total phosphorus is the major limiting factor in algal growth and that all forms of phosphorus are present and playing a role in the production of algal biomass. Like those associated with Secchi depth, these assumptions may not hold true for lakes impacted by domestic sewage, which can contribute higher amounts of orthophosphate, or in lakes naturally enriched with organic material where humic acids can bind with the phosphorus reducing its concentration in the water column.
Unlike total phosphorus, which may or may not be the primary limiting factor in algal production, CHL concentration provides a more direct measure of phytoplankton abundance. Also, CHL concentration is not affected by non-algal turbidity like Secchi depth can be. Therefore, IDEM uses the TSI for CHL for trophic state classification for the purposes of its CWA 314 assessments using the classification systems shown in Table 14. However, because divergent results for a given lake allow for comparisons that can yield additional insights into how different components of a lake's ecosystem might be functioning, all three trophic scores are reported for each lake where possible.
Table 14: Trophic states and predicted characteristics based on Carlson TSI scores for chlorophyll-a (CHL).
| | | |
| Trophic State | TSI (CHL) | Corresponding CHL values (μg/L) | Characteristics of Trophic State |
| Oligotrophic | Less than 40 | Less than 0.95 – 2.6 | ° Low biological productivity
° High transparency (clear water)
° Low levels of nutrients
° Low algal production and little/no aquatic vegetation
° Well oxygenated hypolimnion year round; hypolimnion of shallower lakes may become anoxic at TSI scores greater than 30 |
| Mesotrophic | 40-50* | 2.6-7.3 | ° Moderate biological productivity
° Moderately transparency (moderately clear water)
° Moderate levels of nutrients
° Beds of submerged aquatic plants
° Increasing possibility of anoxia in the hypolimnion during summer |
| Eutrophic | 50-70 | 7.3-56 | ° High biological productivity
° Water has a low transparency
° High levels of nutrients
° Large amounts of aquatic plants or algae
° At TSI scores greater than 60, blue-green algae dominate and algal scums and excessive macrophytes possible
° Hypolimnion commonly anoxic; fish kills possible |
| Hypereutrophic | Greater than 70 | 56-155 | ° Very high biological productivity
° Very low transparency, usually less than 3 feet
° Very high levels of nutrients
° Dense algae and aquatic vegetation; algal scums and few aquatic plants at TSI scores greater than 80
° Fish kills and/or dead zones below the surface are common
° Hypolimnion persistently anoxic; Fish kills and/or "dead zones" below the surface common |
*Lakes with a TSI score of 50, which is on the boundary between mesotrophic and eutrophic conditions, are evaluated with their corresponding TSI scores for TP and SD along with any other available information and classified in accordance to the best professional judgment of IDEM scientists.
Trend Assessments of Indiana Lakes
IDEM's method for assessing trends for the purposes of CWA Section 314 is not statistical in nature. Rather, it was developed through the best professional judgement of IDEM scientists and based on very small data sets with results separated, in many cases, by more than a decade. IDEM uses Carlson TSI scores for CHL for this purpose. Trend assessments require two or more Carlson TSI scores for CHL from sampling conducted from 1990 to present day with at least one score having been determined from data collected in the most recent five years (Figure 4). Each lake with sufficient data may be assessed as stable, improving, degrading, or fluctuating, which is intended to provide insight as to how natural conditions and human activities may be impacting the lake.
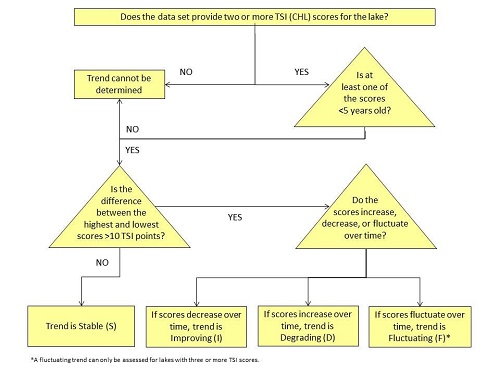
Figure 4: IDEM's method for assessing trends in the trophic condition of Indiana lakes.
CONSOLIDATED LISTING METHODOLOGY
For the development of its 303(d) List of Impaired Waters, IDEM has followed, to the degree possible, the 305(b) and 303(d) reporting methods outlined in the U.S. EPA's Guidance for 2006 Assessment, Listing and Reporting Requirements Pursuant to Sections 303(d), 305(b), and 314 of the CWA (U.S. EPA, 2005), as well as the additional guidance provided in the U.S. EPA memorandums containing information concerning CWA Sections 303(d), 305(b), and 314 integrated reporting and listing decisions for the 2008, 2010, 2012, 2014, and 2016 cycles (U.S. EPA, 2006-2013a). The 303(d) list was developed using the water quality assessment data maintained by IDEM in U.S. EPA's ATTAINS. Interpretation of the data and listing decisions takes into account IDEM's assessment methodologies and the U.S. EPA's guidance.
Data from a given monitoring site are considered representative of the waterbody for that distance upstream and downstream in which there are no significant influences to the waterbody that might cause a change in water quality. Using this same rationale, data may also be extrapolated to some distance into tributaries upstream of a given sampling location. Waterbody AUs with one or more monitoring sites upstream and downstream and those for which reliable assessments can be made based on extrapolation of representative data are classified as monitored. Only monitored waterbodies are considered for 303(d) listing purposes. Any waters identified as "Not Supporting" of one or more designated uses in accordance with the criteria described in previous sections of this methodology are placed on Indiana's 303(d) List of Impaired Waters.
Interpretation of the data through the 305(b) assessment process and the subsequent 303(d) listing decisions are based in large part on U.S. EPA guidance, which calls for a comprehensive listing of all monitored or assessed waterbodies in the state. Prior to 2006, U.S. EPA required that states place each waterbody into only one category. The U.S. EPA now encourages states to place a waterbody AU into additional categories as appropriate in order to more clearly illustrate where progress has been made in TMDL development and other restoration efforts. Therefore, waterbodies are assigned to one category for each of the following designated uses: aquatic life use, recreational use, fish consumption21, and public water supply22. The following describes IDEM's categorization of Indiana waters in more detail:
| | |
| Category 1 | The available data or information, or both, indicate that all designated uses are supported and no use is threatened. Waters are listed in this category if there are data or other information, or both, that meet the requirements of Indiana's Consolidated Assessment and Listing Methodology (CALM) to support a determination that all designated uses are supported and no designated use is threatened. |
| Category 2 | The available data or information, or both, indicate the individual designated use is supported. Waters are listed in this category if there are data or other information, or both, available that meet the requirements of Indiana's CALM to support a determination that the individual designated use is supported. |
| Category 3 | The available data or other information, or both, are insufficient data to determine if the individual designated use is supported. Waters are listed in this category if there are no data or other information, or both, to determine whether the individual designated use is supported or if the available data or information, or both, are not consistent with the requirements of Indiana's CALM. |
| Category 4 | The available data or information, or both, indicate that the individual designated use is impaired or threatened but a total maximum daily load (TMDL) is not required based on one of the following conditions: |
| | A. | A TMDL for one or more pollutants has been completed and approved by U.S. EPA and is expected to result in attainment of all water quality criteria applicable to the designated use. |
| | B. | Other pollution control requirements are reasonably expected to result in the attainment of all water quality criteria applicable to the designated use in a reasonable period of time. Consistent with the regulation under 40 CFR Part 130.7(b)(i),(ii), and (iii), waters are listed in this subcategory where other pollution control requirements required by local, state, or federal authority are stringent enough to achieve any water quality criteria applicable to the designated use. |
| | C. | Impairment is not caused by a pollutant. Waters are listed in this subcategory if the designated use impairment is not caused by a pollutant but is, instead, attributed to other types of pollution for which a TMDL cannot be calculated. |
| Category 5 | The available data or information, or both, indicate the individual designated use is impaired or threatened, and a TMDL is required. The following subcategories together constitute Indiana's 303(d) List of Impaired Waters. |
| | A. | This subcategory constitutes the Section 303(d) list of waters impaired or threatened by one or more pollutants for which a TMDL is required. Waters are listed in this category if it is determined in accordance with Indiana's CALM that a pollutant has caused, is suspected of causing, or is projected to cause impairment. Where more than one pollutant is associated with the impairment of a single AU, the AU will remain in Category 5 for each pollutant until the TMDL for that pollutant has been completed and approved by the U.S. EPA. |
| | B. | This subcategory constitutes the Section 303(d) list of waters that are impaired due to the presence of mercury or PCBs, or both, in the edible tissue of fish collected from the AUs at levels exceeding Indiana's human health criteria for these contaminants. |
The 303(d) List of Impaired Waters consists of all impairments listed in Category 5. This category includes waters where the WQS is not attained because the waterbody AU is impaired or threatened by one or more pollutant(s) for each of which a TMDL is required. However, due to the complex nature of the contaminants involved, IDEM categorizes all fish tissue-related impairments into Category 5B (a state-defined subcategory similar to U.S. EPA's 5M subcategory) deferring development of a conventional TMDL to allow other contaminant clean-up efforts to remedy such impairments.
Because each situation is unique and resources and data sets are sometimes limited, the 303(d) listing process may, at times, require IDEM staff to apply best professional judgment. To help stakeholders understand how designated use support was determined for individual waterbodies of interest, IDEM will make available upon request its water quality assessment notes for any waterbody AU, including any waterbody AU assessed in a different manner than indicated in its Consolidated Assessment and Listing Methodology.
The current 303(d) List of Impaired Waters includes impairments identified on previous 303(d) lists, which still require TMDL development. For an AU to be listed, it must have been assessed using representative data, and the data must support its listing. Any data collected internally by IDEM used for listing decisions must meet the agency's quality assurance and quality control requirements as outlined in IDEM's surface water quality monitoring Quality Assurance Project Plan (QAPP). Data collected from external sources must meet the requirements contained in the technical guidance for IDEM's External Data Framework (IDEM, 2015), which mirror those in IDEM's surface water quality monitoring QAPP for data considered usable for the purposes of CWA Sections 305(b) water quality assessments and 303(d) listing decisions.
U.S. EPA's guidance does not change previous rules established for listing and delisting. The existing regulations require states, at the request of the U.S. EPA's Regional Administrator, to demonstrate good cause for not including impairments on the 303(d) list that were included on previous 303(d) lists (pursuant to 40 CFR Part 130.7(b)(6)(iv)). In general, IDEM will only consider delisting an AU if at least one of the following is true:
• New data indicate that WQS are now being met for the AU under consideration. This would typically occur during IDEM's scheduled assessments when reviewing data collected through IDEM's monitoring programs.
• The assessment or listing methodology, or both, has changed, and the AU under consideration would not be considered impaired under the new methodology.
• An error is discovered in the sampling, testing, or reporting of data that led to an inappropriate listing. IDEM will review previous assessments and 303(d) listings when there is reason to believe that the original assessment was not valid. Reassessment (review of previous assessment or 303(d) listing decisions) typically occurs as a result of ongoing quality assurance and quality control (QA/QC) of IDEM's ADB or through inquiry by IDEM staff or external parties. Under these circumstances, the 305(b)/303(d) coordinator works with the IDEM staff initiating the question or receiving it from the external party to gather the necessary information and consult with other staff, as needed, to resolve the question. During reassessment, several types of information are considered, including data quality issues, past assessment methodologies, land use data, historical information from the public, or other relevant information. Regardless of the situation, no assessment is dismissed as invalid based solely on the age of the data.
• It is determined that another program, other than the TMDL program, is better-suited to address the water quality problem, or the problem is determined not to be caused by a pollutant (see Categories 4B23 and 4C above).
• A TMDL has been completed, and the waterbody AU is expected to meet WQS after implementation of the TMDL (see Category 4A above).
TMDL DEVELOPMENT AND PRIORITIZATION FOR OHIO RIVER IMPAIRMENTS
Because the Ohio River is a boundary between states and U.S. EPA Regions, the development of a TMDL for the river will involve more than one state. To date, no TMDLs have been approved for the reaches of the Ohio River that border Indiana. However, ORSANCO is working with Ohio, West Virginia, Kentucky, Illinois, and Indiana (IDEM) to assist U.S. EPA Regions 3, 4, and 5 in completing a bacteria TMDL for the entire river.
TMDL DEVELOPMENT AND PRIORITIZATION FOR ALL OTHER INDIANA WATERS
The CWA does not clearly define the timeline for TMDL development. However, states are required by 40 CFR Part 130.7 to include with their 303(d) lists a priority ranking of impaired waters that will be targeted for TMDL development in the next two years. For each 303(d) listing cycle, IDEM works with U.S. EPA Region 5 to determine IDEM's short term TMDL schedule.
In addition to developing a short term list of TMDL priorities every two years, IDEM has also developed a long term schedule to guide TMDL development through 2022. This schedule is included in the Agency's TMDL Program Priority Framework, which describes IDEM's process for implementing U.S. EPA's long term vision for assessment, restoration, and protection under the CWA Section 303(d) program.
U.S. EPA announced its long term vision in 2013 to improve implementation of the CWA 303(d) Program. In order to achieve the goals of its vision, U.S. EPA required states to develop a framework for prioritizing impaired waters for TMDL development.
IDEM's 303(d) TMDL Program Priority Framework specifically describes IDEM's methods for prioritizing waters for TMDL planning and watershed restoration. IDEM submitted the framework and its long term schedule to U.S. EPA on July 8, 2015. U.S. EPA has since reviewed IDEM's Priority Framework and, in a letter to IDEM dated September 16, 2015, agreed that it meets the goals of its new long term vision. In the future, IDEM may need to revise its schedule for TMDL development in the short or long term depending on unanticipated factors that can impact IDEM's TMDL monitoring activities or development, or both. In such cases, IDEM will follow the methods described in its Program Priority Framework to determine any necessary changes in order to help ensure ongoing consistency with U.S. EPA's long term vision.
REFERENCES CITED
Carlson, R., 1977. A Trophic State Index for Lakes. Association for the Sciences of Limnology and Oceanography, Inc. pp. 181-380. https://aslopubs.onlinelibrary.wiley.com/doi/abs/10.4319/lo.1977.22.2.0361.
Indiana Administrative Code (IAC): http://iac.iga.in.gov/iac/title327.html
Indiana Department of Environmental Management. 2000. Indiana's Source Water Assessment Plan. Indianapolis, Indiana: Indiana Department of Environmental Management. 159 pp. http://in.gov/idem/cleanwater/2368.htm
Indiana Department of Environmental Management. 2004. Quality Assurance Project Plan for Indiana Surface Water Quality Monitoring and Total Maximum Daily Load (TMDL) Program. Indianapolis, IN: Indiana Department of Environmental Management.
Indiana Department of Environmental Management. 2005. Surface Water Quality Monitoring Strategy 2006-2010. Indianapolis, IN: Indiana Department of Environmental Management.
Indiana Department of Environmental Management. 2010. Surface Water Quality Monitoring Strategy 2011-2019. Indianapolis, IN: Indiana Department of Environmental Management.
Indiana Department of Environmental Management. 2015. Technical Guidance for the Office of Water Quality External Data Framework. Indianapolis, IN: Indiana Department of Environmental Management.
Indiana Department of Environmental Management. 2016.
Office of Water Quality Notice of Public Comment Period for the Draft 2016 List of Impaired Waters and Consolidated Assessment and Listing Methodology under Section 303(d) of the Clean Water Act. Indianapolis, IN: Indiana Register, April 6, 2016. http://iac.iga.in.gov/iac/
20160406-IR-318160129ONA.xml.html
Karr, J.R.; K.D. Fausch; P.L. Angermeier; P.R. Yant; and I.J. Schlosser 1986. Assessing Biological Integrity in Running Waters: A method and its rationale. Special publication 5. Champaign, IL: Illinois Natural History Survey.
LTI. 2007. Spatial Data Analysis for Developing Lake Nutrient Standards: Draft Report to Indiana Department of Environmental Management. Ann Arbor, Michigan: LTI Incorporated.
Omernik, J.M. and A.L. Gallant. 1988. Ecoregions of the Upper Midwest States. Corvallis, OR: U.S. Environmental Protection Agency, Environmental Research Laboratory. EPA-600-3-88-037.
Ohio River Valley Sanitation Commission. 2006. Ohio River Valley Sanitation Commission Pollution Control Standards for discharges to the Ohio River, 2006 Revision. Cincinnati, OH: Ohio River Valley Sanitation Commission.
Risch, M.R. and A.L. Fredericksen. 2015. Mercury and Methylmercury in Reservoirs in Indiana. Professional Paper 1813. Reston, Virginia: U.S. Geological Survey. 57 pp. ISSN 2330-7102 (online): http://dx.doi.org/10.3133/pp1813.
Soranno, P. A. and K. Spence Chervuli, et al. Michigan State University, Department of Fisheries and Wildlife. Personal communication to LTI Inc.
U.S. Environmental Protection Agency. 1986. Ambient Water Quality Criteria for Bacteria. Washington, D.C.: U.S. Environmental Protection Agency. EPA440/5-84-002.
U.S. Environmental Protection Agency. 1992. Great Lakes Monitoring and Research Strategy. U.S. Environmental Protection Agency, Office of Research and Development: Washington, D.C. 218 pp. EPA/620/R-92/001. http://nepis.epa.gov/
U.S. Environmental Protection Agency. 1997. Guidelines for Preparation of the State Water Quality Assessments (305[b] Reports) and Electronic Updates: Supplement. Washington, D.C.: U.S. Environmental Protection Agency. EPA-841-B-97-002B.
U.S. Environmental Protection Agency. 2000a. Office of Water Memorandum: Guidance to Promote Consistency in the Use of Fish and Shellfish Tissue Data by States, Territories, Authorized Tribes and EPA Regional Offices in Clean Water Act Section 303(d) Decision-making. Washington, D.C.: U.S. Environmental Protection Agency, Office of Water. WQSP-00-03.
U.S. Environmental Protection Agency. 2000b. Methodology for Deriving Ambient Water Quality Criteria for the Protection of Human Health. Office of Water. EPA-822-B-00-004.
U.S. Environmental Protection Agency. 2000c. Nutrient Criteria Technical Guidance Manual: Lakes and Reservoirs, First Edition. Washington, D.C.: U.S. Environmental Protection Agency, Office of Water. EPA-822-B00-001.
U.S. Environmental Protection Agency. 2001. Water Quality Criterion for the Protection of Human Health: Methylmercury. Washington, D.C.: U.S. Environmental Protection Agency, Office of Water. EPA-823-R-01-001.
U.S. Environmental Protection Agency. 2003. Guidance for 2004 Assessment, Listing and Reporting Requirements Pursuant to Sections 303(d) and 305(b) of the Clean Water Act, July 21, 2003. Washington, D.C.: U.S. Environmental Protection Agency.
U.S. Environmental Protection Agency. 2005. Guidance for 2006 Assessment, Listing and Reporting Requirements Pursuant to Sections 303(d), 305(b) and 314 of the Clean Water Act, July 29, 2005. Washington, D.C.: U.S. Environmental Protection Agency.
U.S. Environmental Protection Agency. 2006. Information Concerning 2008 Clean Water Act Sections 303(d), 305(b), and 314 Integrated Reporting and Listing Decisions. Washington, D.C.: U.S. Environmental Protection Agency.
U.S. Environmental Protection Agency. 2009. Information Concerning 2010 Clean Water Act Sections 303(d), 305(b), and 314 Integrated Reporting and Listing Decisions. Washington, D.C.: U.S. Environmental Protection Agency.
U.S. Environmental Protection Agency. 2010. Guidance for Implementing the January 2001 Methylmercury Water Quality Criterion. Washington, D.C.: U.S. Environmental Protection Agency. EPA 823-R-10-001.
U.S. Environmental Protection Agency. 2011. Information Concerning 2012 Clean Water Act Sections 303(d), 305(b), and 314 Integrated Reporting and Listing Decisions. March 21, 2011 Memorandum from U.S. EPA Office of Wetlands, Oceans and Watershed to U.S. EPA Regional Water Division Directors and Directors in U.S. EPA's Region 1 Office of Environmental Measurement and Evaluation, Region 2 Division of Environmental Science and Assessment, Region 7 Environmental Sciences Division, and Region 10 Office of Environmental Assessment. Washington, D.C.: U.S. Environmental Protection Agency.
U.S. Environmental Protection Agency. 2013a. Information Concerning 2014 Clean Water Act Sections 303(d), 305(b), and 314 Integrated Reporting and Listing Decisions. September 3, 2013 Memorandum from U.S. EPA Office of Wetlands, Oceans and Watershed to U.S. EPA Regional Water Division Directors and the U.S. EPA Region 1 Office of Environmental Measurement and Evaluation. Washington, D.C.: U.S. Environmental Protection Agency.
U.S. Environmental Protection Agency. 2013b. National Primary Drinking Water Regulations: Revisions to the Total Coliform Rule; Final Rule. 40 CFR Parts 141 and 142: https://www.gpo.gov/fdsys/pkg/FR-2013-02-13/pdf/2012-31205.pdf
U.S. Environmental Protection Agency. 2015a. Information Concerning 2016 Clean Water Act Sections 303(d), 305(b), and 314 Integrated Reporting and Listing Decisions. August 13, 2015 Memorandum from U.S. EPA Office of Wetlands, Oceans and Watershed to U.S. EPA Water Division Directors, Regions 1-10 and the U.S. EPA Region 1 Office of Environmental Measurement and Evaluation. Washington, D.C.: U.S. Environmental Protection Agency.
U.S. Environmental Protection Agency. 2015b. Drinking Water Health Advisory for the Cyanobacterial Microcystin Toxins. U.S. Environmental Protection Agency, Office of Water, Health and Ecological Criteria Division: Washington, D.C. 67 pp. EPA-820R15100.
U.S. Environmental Protection Agency. 2015c. Drinking Water Health Advisory for the Cyanobacterial Toxin Cylindrospermopsin. U.S. Environmental Protection Agency, Office of Water, Health and Ecological Criteria Division: Washington, D.C. 44 pp. EPA-820R15101.
U.S. Environmental Protection Agency. 2017. Information Concerning 2018 Clean Water Act Sections 303(d), 305(b), and 314 Integrated Reporting and Listing Decisions. December 22, 2017 Memorandum from U.S. EPA Office of Wetlands, Oceans and Watershed to U.S. EPA Water Division Directors, Regions 1-10 and U.S. EPA Environmental Services Division Directors. Washington, D.C.: U.S. Environmental Protection Agency.
CALM ATTACHMENT A
Comparisons of Indiana's Water Quality Criteria to ORSANCO'S Pollution Control Standards and
Other Criteria for Making Designated Use Support Assessments for the Ohio River
Table A-1: Comparison of criteria used to determine recreational use support.
| | | | |
| Indicator | Type of Criteria | ORSANCO's Recreational Use Criteria | Indiana's Recreational Use Criteria | Most Stringent Criteria [1] |
| E. coli | Geometric Mean | Applicable April-October (Recreational Season)
May not exceed 130 cfu/100 ml as a 90-day geometric mean based on not fewer than five samples per month | Applicable April-October (Recreational Season)
May not exceed 125 cfu/100 ml based on not fewer than five equally spaced samples over a 30-day period.
If five equally spaced samples are not available for the calculation of a geometric mean, single sample maximum applies | Indiana |
| E. coli | Single Sample Maximum | Applicable April-October (Recreational Season)
May not exceed 240 cfu/100 ml in more than 25% of samples | Applicable April-October (Recreational Season)
May not exceed 235 cfu/100 ml in any one sample in a thirty day period
Except
In cases where there are at least ten samples at a given site, up to 10% may exceed the single sample maximum
If
The exceedances are incidental and attributable solely to the discharge of treated wastewater from a wastewater treatment plant as defined in Indiana Code
And
The geometric mean criterion is met | Indiana |
[1]Although Indiana's E. coli numeric criteria are slightly more stringent than ORSANCO's, unlike Indiana's WQS, ORSANCO's criteria do not allow exceptions. ORSANCO's assessment methodology also incorporates analysis of single sample results, which provides a more robust assessment than Indiana's combined criteria and assessment methodology can. Indiana, therefore, accepts ORSANCO's assessments of recreational use support for the Ohio River.
Table A-2: Comparison of criteria used to determine fish consumption use support.
| | | | |
| Indicator | Type/Source of Criteria | ORSANCO Criteria | Indiana
Criteria | Most Stringent Criteria |
| Methylmercury in Fish Tissue (μg/L) | Human Health Criterion for Methylmercury (U.S. EPA, 2001) | 0.3 | 0.3 | Equally Stringent |
| Total Mercury in Water (μg/L) | Aquatic Life CAC (4-day average) Outside the Mixing Zone (Indiana)
Not to exceed (ORSANCO) | 0.012 | 0.012 | Equally Stringent |
| Dioxin (2, 3, 7, 8-TCDD) in Water (μg/L) | CCC Human Health (30-day average) Outside the Mixing Zone (Indiana)
CWA Section 304(a) Human Health Criterion for Priority Pollutants (ORSANCO) | 0.000000005 | 0.0000001 | ORSANCO |
| Polychlorinated Biphenyls (PCBs) in Water (μg/L)[1] | CCC for Human Health (30-day average) Outside the Mixing Zone (Indiana)
CWA Section 304(a) Human Health Criterion for Priority Pollutants (ORSANCO) | 0.000064[2] | 0.00079 | ORSANCO |
[1] Indiana has two criteria for PCBs that could be used to make fish consumption use assessments, both of which address different ways of preventing exposure through consumption of fish, one by preventing bioaccumulation of the contaminant in the fish and the other to protect against exposure through the consumption of contaminated fish. The criterion shown in the table is the CCC Human Health criterion for waters outside the mixing zone. Human health criteria are calculated for and intended to protect from exposure through public drinking water supplies withdrawn from surface waters and nondrinking water exposures, such as consumption of fish. Therefore, the human health criteria (both ORSANCO's and Indiana's) are appropriate for use in fish consumption assessments. The Aquatic Life CAC of 0.014 μg/L for PCBs could be used in a similar manner as the Aquatic Life CAC for total mercury to prevent bioaccumulation of PCBs in fish. However, the Human Health CCC for PCBs is far more protective and is used instead to make fishable use assessments for the Ohio River. The opposite is true for total mercury, which is why the Aquatic Life CAC of 0.012 μg/L is used instead of the Human Health CCC of 0.15 μg/L.
[2] This criterion applies to total PCBs (the sum of all congener or all isomer or homolog or Arochlor analyses).
Table A-3: Comparison of metals criteria used to determine aquatic life use support. Hardness is expressed as mg/l of CaCO3.
| | | | | | | |
| Metal | Fraction | Acute or Chronic | ORSANCO's Criterion Concentration (μg/L) | ORSANCO's Dissolved Criterion Conversion Factors[1] | Indiana's Criterion Concentration (μg/L) | Indiana's Dissolved Criterion Conversion Factors | Most Stringent Criteria |
| Mercury[2] | Dissolved (ORSANCO) Total (Indiana) | Chronic | 0.91 (Total) | 0.85 (Dissolved) | 0.012 (Total) | NA | Indiana |
| Arsenic[2] | Dissolved[3] | Chronic | 150 | 1.0 | 190 | 1 | ORSANCO |
| Cadmium | Dissolved[3] | Chronic | e(0.7409(ln hardness)-4.719) | 1.101672 - [ln(hardness) * 0.041838] | e(0.7852[ln (hardness)]-3.490) | 1.101672 - [(ln(hardness) (0.041838)] | ORSANCO |
| Chromium III | Dissolved[3] | Chronic | e(0.819[ln (hardness)]+0.6848) | 0.86 | e(0.8190[ln (hardness)]+1.561) | 0.860 | ORSANCO |
| Chromium VI | Dissolved[3] | Chronic | 11 | 0.962 | 11 | 0.962 | Equally stringent |
| Copper | Dissolved[3] | Chronic | e(0.8545(ln hardness)-1.702) | 0.960 | e(0.8545[ln (hardness)]-1.465) | 0.960 | ORSANCO |
| Lead | Dissolved[3] | Chronic | e(1.273(ln hardness)-4.705) | 1.46203 - [ln(hardness) * 0.145712] | e(1.273[ln (hardness)]-4.705) | 1.46203 - [(ln hardness) (0.145712)] | Equally
stringent |
| Nickel | Dissolved[3] | Chronic | e(0.846(ln hardness)+0.0584) | 0.997 | e(0.846[ln (hardness)]+1.1645) | 0.997 | ORSANCO |
| Selenium | Total | Chronic | 5 | -- | -- | -- | ORSANCO |
| Silver | Dissolved[3] | Acute | e(1.72(ln hardness)-6.59) | -- | e(1.72[ln (hardness)]-6.52)/2 | 0.85 | Indiana |
| Zinc | Dissolved[3] | Chronic | e(0.8473(ln hardness)+0.884) | 0.986 | e(0.8473[ln (hardness)]+0.7614) | 0.986 | Indiana |
[1] The asterisks used in this column are used to denote a multiplication sign.
[2] This criterion is expressed in ORSANCO's Pollution Control Standards as "Not to Exceed" and in Indiana's WQS as a four-day average.
[3] Unless otherwise shown, dissolved metals criteria are calculated as the total recoverable criterion multiplied by the dissolved criterion conversion factor. Assessments are made by comparing dissolved results against the established or calculated criterion.
Table A-4: Comparison of sulfate and cyanide criteria used to determine aquatic life use support. Hardness is expressed as mg/l of CaCO3.
| | | | |
| Indicator | Type of Criteria | ORSANCO's ALUS Criteria | Indiana's ALUS Criteria[1] | Most Stringent Criteria |
| Free Cyanide[2] (μg/L) | Chronic | 5.2 | 5.2 | Equally stringent |
| Chloride[3] (mg/L) | Chronic | No criterion | 177.87*(hardness)0.205797 *(sulfate)-0.07452 | Indiana |
Sulfate[4] (mg/L): Hardness greater than or equal to 100 mg/L but less than or equal to 500 mg/L
And
Chloride (mg/L) greater than or equal to 5 mg/L but less than 25 mg/L | Not to Exceed | No criterion | [-57.478+(5.79*hardness) +(54.163*chloride)]*0.65 | Indiana |
Sulfate[4] (mg/L): Hardness greater than or equal to 100 mg/L but less than or equal to 500 mg/L
And
Chloride (mg/L) greater than or equal to 25 mg/L but less than or equal to 500 mg/L | Not to Exceed | No criterion | [1276.7+(5.508*hardness) - (1.457*chloride)]*0.65 | Indiana |
Sulfate[4] (mg/L): Hardness less than 100 mg/L
And
Chloride (mg/L) less than or equal to 500 mg/L | Not to Exceed | No criterion | 500 | Indiana |
Sulfate[4] (mg/L): Hardness greater than 500 mg/L
And
Chloride (mg/L) greater than or equal to 5 mg/L but less than 25 mg/L | Not to Exceed | No criterion | [57.478+(5.79*500) + (54.163*chloride)]*0.65 | Indiana |
Sulfate[4] (mg/L): Hardness greater than 500 mg/L
And
Chloride (mg/L) greater than or equal to 25 mg/L but less than or equal to 500 mg/L | Not to Exceed | No criterion | [1.276+(5.508*500) - (1.457*chloride)]*0.65 | Indiana |
[1] The asterisks used in this column are used to denote a multiplication sign.
[2] This criterion is expressed in ORSANCO's Pollution Control Standards as "Not to Exceed" and in Indiana's WQS as a 4-day average.
[3] Indiana's criterion for chloride is a calculated criterion which requires both hardness and sulfate values and is rounded to nearest whole number for the purposes of assessment. ORSANCO's Pollution Control Standards do not contain a chloride criterion for the protection of aquatic life. Therefore, IDEM uses the data collected by ORSANCO for the purposes of making its aquatic life use assessments for the Ohio River.
[4] Indiana's criterion for sulfate is a calculated criterion which requires both hardness and chloride values and is rounded to nearest whole number for the purposes of assessment. ORSANCO's Pollution Control Standards do not contain a sulfate criterion for the protection of aquatic life. Therefore, IDEM uses the data collected by ORSANCO to calculate the applicable criteria for the purposes of making its aquatic life use assessments for the Ohio River.
Table A-5: Comparison of ammonia, dissolved oxygen, pH, and temperature criteria used to determine aquatic life use support.
| | | | |
| Indicator | Type of Criteria | ORSANCO's ALUS Criteria[1] | Indiana's ALUS Criteria[1] | Most Stringent Criteria |
| Ammonia (mg/L) applicable March 1 to October 31 | Not to Exceed | 0.8876 * [((0.0278/1+107.688-pH) + (1.1994/(1+10 pH-7.688)) * (2.126 * 100.028 * (20-Max (T or 7)))]
Where: T = Temperature in °C
Notes:
These criteria apply when unionid mussels are present. For purposes of determining the applicable water quality-based limitations on ammonia-nitrogen, unionid mussels shall be presumed to be present at all times in the Ohio River unless the applicant demonstrates to the satisfaction of the permitting authority and ORSANCO that mussels are absent. | [((0.0577/(1+107.688-pH))) + (2.487/(1-10pH-7.688))] * MIN (2.85, (1.45*10 0.028*(25 - T))
Where: T = Temperature in °C
Notes:
For the above
equation, multiply the parenthetical equation by 2.85 when T is less than or equal to 14.51°C.
When T is greater than 14.51°C, multiply the parenthetical equation by (1.45 * 100.028*(25-T)
| ORSANCO |
| Ammonia (mg/L) applicable November 1 to last day of February | Not to Exceed | 0.8876 * [((0.0278/1+107.688-pH) + (1.1994/(1+10 pH-7.688)) * (2.126 * 100.028 * (20-Max (T or 7)))]
Where: T = Temperature in °C
Notes:
These criteria apply when unionid mussels are present. For purposes of determining the applicable water quality-based limitations on ammonia-nitrogen, unionid mussels shall be presumed to be present at all times in the Ohio River unless the applicant demonstrates to the satisfaction of the permitting authority and ORSANCO that mussels are absent. | [((0.0577/(1+107.688-pH))) + (2.487/(1-10pH-7.688))] * (1.45*10 0.028*(25 - (Maximum [T OR 7])))
Where: T = Temperature in °C
Notes:
For
the above equation, the last term should be 100.028*(25-T)) for all T greater than 7°C
When T is equal to or less than 7°C or less, the last term in the equation should be 10(0.028*(25-7)) or 10(0.504) | ORSANCO |
| Dissolved Oxygen (mg/L) applicable April 15 to June 15 | Not to Exceed | Minimum concentration 5.0 at all times | Average concentration at least 5.0 per calendar day and a minimum concentration of 4.0 at all times | ORSANCO |
| Dissolved Oxygen (mg/L) applicable June 16 to April 14 | Not to Exceed | Average concentration at least 5.0 per calendar day and a minimum concentration of 4.0 at all times | Average concentration at least 5.0 per calendar day and a minimum concentration of 4.0 at all times | Equally stringent |
| pH (standard units) | Not to Exceed | No value less than 6.0 nor greater than 9.0 | No value less than 6.0 nor greater than 9.0 | Equally stringent |
| Temperature (expressed in °C and °F) | Not to exceed | Allowable values expressed as Period Averages and Maximum Temperatures | Allowable values expressed as Maximum Temperatures | ORSANCO[2] |
[1] The asterisks used in this column are used to denote a multiplication sign.
[2] Both ORSANCO's Pollution Control Standards and Indiana's WQS articulate maximum allowable temperatures. ORSANCO's standards also include allowable period average temperatures, which are more stringent than the maximum allowable temperatures in either set of standards.
Table A-6: Comparison of human health criteria and other criteria used to determine public water supply use support.
| | | |
| Parameter | ORSANCO's Criterion Concentration | Indiana's Criterion Concentration | Most Stringent Criteria |
| Antimony (Total) | 5.6 μg/L | 146 μg/L | ORSANCO |
| Arsenic (Total) | 10 μg/L | 0.022 μg/L | Indiana |
| Barium (Total) | 1,000 μg/L | 1,000 μg/L | Equally stringent |
| Beryllium (Total) | No criterion | 0.068 μg/L | Indiana |
| Cadmium (Total) | No criterion | 10 μg/L | Indiana |
| Copper (Total) | 1,300 μg/L | No criterion | ORSANCO |
| Mercury (Total) | 0.012 μg/L | 0.14 μg/L | ORSANCO |
| Nickel (Total) | 610 μg/L | 13.4 μg/L | Indiana |
| Selenium (Total) | 170 μg/L | 10 μg/L | Indiana |
| Silver (Total) | 50 μg/L | 50 μg/L | Equally stringent |
| Thallium (Total) | 0.24 μg/L | 48 μg/L | ORSANCO |
| Zinc (Total) | 7,400 μg/L | No criterion | ORSANCO |
| Cyanide (Total) | 140 μg/L | 200 μg/L | ORSANCO |
| Fluoride | 1.0 mg/L | 1.0 mg/L[1] | Equally stringent |
| Nitrogen (as Nitrate-Nitrite) | 10 mg/L | 10 mg/L | Equally stringent |
| Nitrite | 1 mg/L | 1 mg/L | Equally stringent |
| Sulfate | 250 mg/L[2] | 250 mg/L | Equally stringent |
| Chloride | 250 mg/L | 250 mg/L | Equally stringent |
| Phenol | 0.005 mg/L[2] | 3.5 mg/L | ORSANCO |
| Total Dissolved Solids | 500 mg/L[2] | 750 mg/L | ORSANCO |
| Specific Conductance | No criteria | 1,200 micromhos/cm | Indiana |
| Fecal Coliform | May not exceed 2,000 cfu/100 ml as a geometric mean calculated from five samples collected over a one-month period | May not exceed:
5,000 cfu/100 ml as a monthly average value
Or
5,000 cfu/100 ml in greater than 20% of samples collected in a given month
Or
20,000 cfu/100 ml in less than 5% of all samples collected in a given month | ORSANCO |
[1] This criterion is applicable to all waters outside the mixing zone and to all designated uses.
[2] This criterion is not a human health criterion. Rather, it is identified as a taste and odor protection criterion as defined in Section 2.2 of ORSANCO's PCS.
CALM ATTACHMENT B
IDEM's Assessment Unit IDs for the Ohio River Keyed to ORSANCO Pools
Table B-1: IDEM assessment unit IDs for the Ohio River and their corresponding mile points and ORSANCO pools, which are defined (bounded by) a series of high-lift locks and dams along the river.
| | | | | | |
| Indiana County | 8-Digit Hydrologic Unit Code | Assessment Unit ID | Assessment Unit Name | From Ohio River Mile | To Ohio River Mile | ORSANCO Pool |
| DEARBORN | 05090203 | INH1_01 | OHIO RIVER - STATE LINE TO WOOLPER CREEK (KY) | 491.1 | 499.8 | MARKLAND |
| OHIO | 05090203 | INH1_02 | OHIO RIVER - WOOLPER CREEK (KY) TO MIDDLE CREEK (KY) | 499.8 | 504.5 | MARKLAND |
| OHIO | 05090203 | INH1_03 | OHIO RIVER - MIDDLE CREEK (KY) TO GRANTS CREEK (IN) | 504.5 | 509.6 | MARKLAND |
| SWITZERLAND | 05090203 | INH1_04 | OHIO RIVER - GRANTS CREEK (IN) TO HAMILTON, KY | 509.6 | 514.3 | MARKLAND |
| SWITZERLAND | 05090203 | INH1_05 | OHIO RIVER - HAMILTON, KY TO WADE CREEK (IN) | 514.3 | 518.4 | MARKLAND |
| SWITZERLAND | 05090203 | INH1_06 | OHIO RIVER - WADE CREEK (IN) TO BIG SUGAR CREEK (KY) | 518.4 | 522.4 | MARKLAND |
| SWITZERLAND | 05090203 | INH1_07 | OHIO RIVER - BIG SUGAR CREEK (KY) TO BRYANT CREEK (IN) | 522.4 | 526.6 | MARKLAND |
| SWITZERLAND | 05090203 | INH1_08 | OHIO RIVER - BRYANT CREEK (IN) TO MARKLAND LOCKS AND DAM | 526.6 | 531.6 | MARKLAND |
| SWITZERLAND | 05140101 | INH2_01 | OHIO RIVER - MARKLAND LOCKS AND DAM TO BLACK ROCK CREEK (KY) | 531.6 | 536.7 | MCALPINE |
| SWITZERLAND | 05140101 | INH2_02 | OHIO RIVER - BLACK ROCK CREEK (KY) TO 2 MILES DS OF INDIAN CREEK (IN) | 536.7 | 541.5 | MCALPINE |
| SWITZERLAND | 05140101 | INH2_03 | OHIO RIVER - 2 MILES DS OF INDIAN CREEK (IN) TO KENTUCKY RIVER (KY) | 541.5 | 545.3 | MCALPINE |
| JEFFERSON | 05140101 | INH3_01 | OHIO RIVER - KENTYCKY RIVER (KY) TO INDIAN KENTUCK CREEK (IN) | 545.3 | 549.9 | MCALPINE |
| JEFFERSON | 05140101 | INH3_02 | OHIO RIVER - INDIAN KENTUCK CREEK (IN) TO EAGLE HOLLOW, IN | 549.9 | 554.8 | MCALPINE |
| JEFFERSON | 05140101 | INH3_03 | OHIO RIVER - EAGLE HOLLOW, IN TO CLIFTY CREEK (IN) | 554.8 | 559.6 | MCALPINE |
| JEFFERSON | 05140101 | INH3_04 | OHIO RIVER - CLIFTY CREEK (IN) TO HARTE FALLS CREEK (IN) | 559.6 | 563.8 | MCALPINE |
| JEFFERSON | 05140101 | INH3_05 | OHIO RIVER - HARTE FALLS (IN) TO MARBLE HILL, IN | 563.8 | 569.9 | MCALPINE |
| CLARK | 05140101 | INH3_06 | OHIO RIVER - MARBLE HILL, IN TO PATTONS CREEK (KY) | 569.9 | 575.6 | MCALPINE |
| CLARK | 05140101 | INH3_07 | OHIO RIVER - PATTONS CREEK (KY) TO WESTPORT, KY | 575.6 | 580.2 | MCALPINE |
| CLARK | 05140101 | INH3_08 | OHIO RIVER - WESTPORT, KY TO OWEN CREEK (IN) | 580.2 | 585.5 | MCALPINE |
| CLARK | 05140101 | INH3_09 | OHIO RIVER - OWN CREEK (IN) TO JENNY LIND RUN (IN) | 585.5 | 591.3 | MCALPINE |
| CLARK | 05140101 | INH3_10 | OHIO RIVER - JENNY LIND RUN (IN) TO UTICA, IN | 591.3 | 598.2 | MCALPINE |
| CLARK | 05140101 | INH3_11 | OHIO RIVER - UTICA, IN TO JEFFERSONVILLE, IN | 598.2 | 605.7 | MCALPINE |
| CLARK | 05140101 | INH3_12 | OHIO RIVER - JEFFERSONVILLE, IN TO MCALPINE LOCKS AND DAM | 605.7 | 609.4 | MCALPINE |
| FLOYD | 05140101 | INH3_13 | OHIO RIVER - MCALPINE LOCKS AND DAM TO NEW ALBANY, IN | 609.4 | 613.0 | CANNELTON |
| FLOYD | 05140101 | INH4_01 | OHIO RIVER - NEW ALBANY, IN TO MILL CREEK CUTOFF (KY) | 613.0 | 619.6 | CANNELTON |
| HARRISON | 05140101 | INH4_02 | OHIO RIVER - MILL CREEK CUTOFF (KY) TO SUGAR GROVE, IN | 619.6 | 625.1 | CANNELTON |
| HARRISON | 05140101 | INH4_03 | OHIO RIVER - SUGAR GROVE, IN TO MEADOW LAWN, KY | 625.1 | 628.2 | CANNELTON |
| HARRISON | 05140101 | INH4_04 | OHIO RIVER - MEADOW LAWN, KY TO SALT RIVER (KY) | 628.2 | 633.2 | CANNELTON |
| HARRISON | 05140104 | INH4_05 | OHIO RIVER - SALT RIVER (KY) TO MOSQUITO CREEK (IN) | 633.2 | 637.7 | CANNELTON |
| HARRISON | 05140104 | INH5_01 | OHIO RIVER - MOSQITO CREEK (IN) TO DOE RUN (KY) | 637.7 | 645.5 | CANNELTON |
| HARRISON | 05140104 | INH5_02 | OHIO RIVER - DOE RUN (KY) TO BUCK CREEK (KY) | 645.5 | 650.5 | CANNELTON |
| HARRISON | 05140104 | INH5_03 | OHIO RIVER - BUCK CREEK (KY) TO FRENCH CREEK (KY) | 650.5 | 654.5 | CANNELTON |
| HARRISON | 05140104 | INH5_04 | OHIO RIVER - FRENCH CREEK (KY) TO NEW AMSTERDAM, IN | 654.5 | 658.9 | CANNELTON |
| HARRISON | 05140104 | INH5_05 | OHIO RIVER - NEW AMSTERDAM, IN TO BLUE RIVER (IN) | 658.9 | 665.9 | CANNELTON |
| CRAWFORD | 05140104 | INH5_06 | OHIO RIVER - BLUE RIVER (IN) TO WOLF CREEK (KY) | 665.9 | 679.7 | CANNELTON |
| CRAWFORD | 05140104 | INH5_07 | OHIO RIVER - WOLF CREEK (KY) TO LITTLE BLUE RIVER (IN) | 679.7 | 681.5 | CANNELTON |
| CRAWFORD/ PERRY | 05140104 | INH5_08 | OHIO RIVER - LITTLE BLUE RIVER (IN) TO SPRING CREEK (KY) | 681.5 | 689.6 | CANNELTON |
| PERRY | 05140104 | INH5_09 | OHIO RIVER - SPRING CREEK (KY) TO OIL CREEK (IN) | 689.6 | 694.3 | CANNELTON |
| PERRY | 05140104 | INH5_10 | OHIO RIVER - OIL CREEK (IN) TO YELLOW BANK CREEK (KY) | 694.3 | 698.2 | CANNELTON |
| PERRY | 05140104 | INH5_11 | OHIO RIVER - YELLOW BANK CREEK (KY) TO SINKING CREEK (KY) | 698.2 | 703.5 | CANNELTON |
| PERRY | 05140104 | INH5_12 | OHIO RIVER - SINKING CREEK (KY) TO BEAR CREEK (IN) | 703.5 | 705.9 | CANNELTON |
| PERRY | 05140201 | INH5_13 | OHIO RIVER - BEAR CREEK (IN) TO CLOVER CREEK (KY) | 705.9 | 713.4 | CANNELTON |
| PERRY | 05140201 | INH5_14 | OHIO RIVER - CLOVER CREEK (KY) TO DEER CREEK (IN) | 713.4 | 720.9 | CANNELTON |
| PERRY | 05140201 | INH5_15 | OHIO RIVER - DEER CREEK (IN) TO CANNELTON LOCKS AND DAM | 720.9 | 722.9 | CANNELTON |
| PERRY | 05140201 | INH5_16 | OHIO RIVER - CANNELTON LOCKS AND DAM TO TELL CITY, IN | 722.9 | 728.0 | NEWBURGH |
| PERRY | 05140201 | INH6_01 | OHIO RIVER - TELL CITY, IN TO ANDERSON RIVER (IN) | 728.0 | 733.3 | NEWBURGH |
| SPENCER | 05140201 | INH6_02 | OHIO RIVER - ANDERSON RIVER (IN) TO CROOKED CREEK (IN) | 733.3 | 735.1 | NEWBURGH |
| SPENCER | 05140201 | INH6_03 | OHIO RIVER - CROOKED CREEK (IN) TO YELLOW CREEK (KY) NEAR LEWISPORT, KY | 735.1 | 738.6 | NEWBURGH |
| SPENCER | 05140201 | INH6_04 | OHIO RIVER - YELLOW CREEK (KY) NEAR LEWISPORT, KY TO GRANDVIEW, IN | 738.6 | 743.9 | NEWBURGH |
| SPENCER | 05140201 | INH6_05 | OHIO RIVER - GRANDVIEW, IN TO ROCKPORT, IN | 743.9 | 748.4 | NEWBURGH |
| SPENCER | 05140201 | INH6_06 | OHIO RIVER - ROCKPORT, IN TO YELLOW CREEK (KY) NEAR OWENSBORO, KY | 748.4 | 753.6 | NEWBURGH |
| SPENCER | 05140201 | INH6_07 | OHIO RIVER - YELLOW CREEK (KY) TO CANEY CREEK (IN) | 753.6 | 760.7 | NEWBURGH |
| SPENCER | 05140201 | INH6_08 | OHIO RIVER - CANEY CREEK (IN) TO LITTLE PIGEON CREEK (IN) | 760.7 | 767.1 | NEWBURGH |
| SPENCER | 05140201 | INH6_09 | OHIO RIVER - LITTLE PIGEON CREEK (IN) TO FRENCH ISLANDS NOS 1 AND 2 | 767.1 | 770.4 | NEWBURGH |
| WARRICK | 05140201 | INH6_10 | OHIO RIVER - FRENCH ISLANDS, NOS 1 AND 2 TO NEWBURGH LOCKS AND DAM | 770.4 | 777.0 | NEWBURGH |
| VANDERBURGH | 05120202 | INH7_01 | OHIO RIVER - NEWBURGH LOCKS AND DAM TO GREEN RIVER (KY) | 777.0 | 785.0 | NEWBURGH |
| VANDERBURGH | 05120202 | INH8_01 | OHIO RIVER - EVANSVILLE, IN (UPSTREAM) TO EVANSVILLE, IN (DOWNSTREAM) | 785.0 | 797.5 | NEWBURGH |
| VANDERBURGH | 05120202 | INH8_02 | OHIO RIVER - EVANSVILLE, IN (DOWNSTREAM) TO HENDERSON, KY | 797.5 | 803.3 | NEWBURGH |
| VANDERBURGH | 05120202 | INH8_03 | OHIO RIVER - HENDERSON, KY TO CANOE CREEK (KY) | 803.3 | 807.5 | NEWBURGH |
| VANDERBURGH | 05120202 | INH8_04 | OHIO RIVER - CANOE CREEK (KY) TO BAYOU CREEK (IN) | 807.5 | 815.8 | NEWBURGH |
| POSEY | 05120202 | INH8_05 | OHIO RIVER - BAYOU CREEK (IN) TO DS END OF OHIO RIVER CHANNEL NORTH OF DIAMOND ISLAND | 815.8 | 822.2 | NEWBURGH |
| POSEY | 05120202 | INH8_06 | OHIO RIVER - OHIO RIVER CHANNEL SOUTH OF DIAMOND ISLAND | 822.2 | 826.3 | NEWBURGH |
| POSEY | 05120202 | INH8_07 | OHIO RIVER - DS END OF DIAMOND ISLAND TO MOUNT VERNON, IN | 826.3 | 833.2 | NEWBURGH |
| POSEY | 05120202 | INH8_08 | OHIO RIVER - MOUNT VERNON, IN TO DS END OF OHIO RIVER CHANNEL WEST OF SLIM ISLAND | 833.2 | 840.3 | NEWBURGH |
| POSEY | 05120202 | INH8_09 | OHIO RIVER CHANNEL EAST OF SLIM ISLAND | 840.3 | 843.3 | NEWBURGH |
| POSEY | 05120202 | INH8_10 | OHIO RIVER - DS END OF SLIM ISLAND TO HOVEY LAKE DRAIN (IN) | 843.3 | 848.2 | NEWBURGH |
| POSEY | 05120202 | INH8_11 | OHIO RIVER - HOVEY LAKE DRAIN (IN) TO LOST CREEK (KY) | 848.2 | 850.4 | NEWBURGH |
| POSEY | 05120202 | INH8_12 | OHIO RIVER - LOST CREEK (KY) TO UNIONTOWN (JOHN T. MYERS) LOCKS | 850.4 | 853.5 | NEWBURGH |
| POSEY | 05120202 | INH9_01 | OHIO RIVER - UNIONTOWN (JOHN T. MYERS) LOCKS AND DAM TO WABASH RIVER | 853.5 | 855.3 | J.T. MYERS |
CALM ATTACHMENT C
Derivation of Criteria Values
for Concentrations of Mercury and PCBs in Fish Tissue
U.S. EPA stipulates that the risk assessment parameters used to categorize fish tissue contaminant data must be at least as protective as those used in the WQS-based fish concentrations. The equation for calculating a fish tissue criterion for PCBs utilizes the guidance provided by U.S. EPA for calculating screening values for target analytes (http://www.epa.gov/waterscience/fishadvice/volume1/v1ch5.pdf). U.S. EPA's Office of Water recommends the use of this calculation method because it is the basis for developing current water quality criteria for the protection of human health. The general equation used for calculating Screening Values (SVs) for carcinogens in fish tissue is derived from this guidance and is as follows:
| |
| SVc = [(RL/CSF)*BW]/CR | Equation C-1 |
SVc = Screening value for a carcinogen (mg/kg; ppm)
RL = Maximum acceptable risk level (dimensionless)
CSF = Oral cancer slope factor (mg/kg-d)-1
BW = Mean body weight of the general population (kg)
CR = Mean daily consumption rate of species of interest (kg/d)
The asterisk is used to denote a multiplication sign.
In determining a screening value or fish tissue criterion for PCBs, the same assumptions and parameters used for calculating human health water quality criteria were applied. These parameters include a BW of 70 kg, CSF (of 2.0 (mg/kg-d)-1, RL of 10-5, and CR of 17.5 (g/d).
The general equation for calculating a fish tissue screening value for PCBs is:
| |
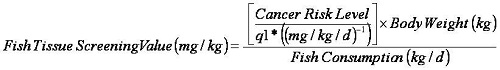 | Equation C-2 |
Cancer risk level (the RL value from equation 1) = 10-5
q1 (the CSF from equation 1) = of 2.0 (mg/kg-d)-1
BW (same in both equations) = 70 kg
Fish Consumption (CR in equation 1) = 17.5 (g/d) or 0.0175 (kg/d)
The asterisk is used to denote a multiplication sign.
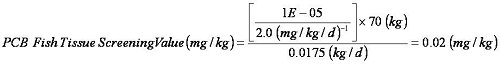
A tissue-based criterion eliminates the need for a bioaccumulation factor in the criterion calculation while PCB exposure from drinking water is negligible (http://www.great-lakes.net/humanhealth/lake/superior.html).
CALM ATTACHMENT D
Comparison of Water Quality Assessment Criteria and Benchmarks for IDEM's
Clean Water Act Public Water Supply Assessments and the Safe Drinking Water Act
Maximum Contaminant Levels for Treated Drinking Water
Table D-1: Water quality assessment criteria and benchmarks used in assessments for public water supply use support. This table also provides maximum contaminant levels (MCLs) regulated under the Safe Drinking Water Act (SDWA) for the purposes of comparison only – MCLs are not used for the purposes of assessment.
| | | | | | |
| Parameter | CWA Human Health (HH) Criteria | Other CWA Criteria Specific to Public Water Supply Use | Other Benchmarks for Assessment | SDWA Maximum Contaminant Level (MCL |
| Great Lakes Basin 327 IAC 2-1.5-8(b) Table 8-3 | Downstate Waters 327 IAC 2-1-6(a) Table 6-1 | Great Lakes Basin 327 IAC 2-1.5-8(f) | Downstate Waters 327 IAC 2-1-6(e) |
| General Chemistry And Physical Properties |
| Chloride, Total | | | 250 mg/L | 250 mg/L | | |
| Cyanide, Total | 600 μg/L | 200 μg/L | | | | |
| Specific Conductance (also known as Conductivity) | | | 1,200 micromhos/cm at 25o Celsius | 1,200 micromhos/cm at 25o Celsius | | |
| Solids, Dissolved (or Specific Conductance as Proxy) | | | 750 mg/L or 1,200 micromhos/cm at 25o Celsius | 750 mg/L or 1,200 micromhos/cm at 25o Celsius | | |
| Sulfate | | | 250 mg/L | 250 mg/L | | |
| Fluoride | | | | 1.0 mg/L Wabash River and Ohio River; 2.0 mg/L All other downstate waters | | 4 μg/L |
| Nutrients |
| Nitrogen, Nitrate+Nitrite | | 10 mg/L | 10 mg/L | | | 10 μg/L |
| Nitrogen, Nitrite | | 1 mg/L | 1 mg/L | | | 1 μg/L |
| Algal Toxins |
| Cylindrospermopsin | | | | | 0.7 mg/L | |
| Microcystin-LR (as a surrogate for total Microcystins) | | | | | 0.3 mg/L | |
| Metals |
| Antimony, Total | | 146 μg/L | | | | 6 μg/L |
| Arsenic (III), Total | | 0.022 μg/L | | | | 10 μg/L |
| Barium, Total | | 1,000 μg/L | | | | 2,000 μg/L |
| Beryllium, Total | | 0.068 μg/L | | | | 4 μg/L |
| Cadmium, Total | | 10 μg/L | | | | 5 μg/L |
| Chromium (III), Total | | 170,000 μg/L | | | | 100 μg/L Chromium, Total |
| Chromium (VI), Total | | 50 μg/L | | | |
| Lead, Total | | 50 μg/L | | | | 15 μg/L* |
| Mercury, Total | 0.0018 μg/L | 0.14 μg/L | | | | 2 μg/L Mercury (inorganic) |
| Methylmercury, Total | 0.0018 μg/L | | | | |
| Nickel, Total | | 13.4 μg/L | | | | |
| Selenium, Total | | 10 μg/L | | | | 50 μg/L |
| Silver, Total | | 50 μg/L | | | | |
| Thallium, Total | | 13 μg/L | | | | 2 μg/L |
| Pesticides |
| Dichlorodiphenyltrichloroethane (also known as DDT) (all derivatives) | 0.00015 μg/L (1.5 x10⁻⁴) | 0.00024 μg/L (2.4 x10⁻⁴) | | | | |
| Benzene Hexachloride (also known as gamma BHC or Lindane) | 0.47 μg/L | 0.19 μg/L | | | | 0.2 μg/L |
| Alpha Hexachlorocyclohexane (also known as alpha HCH) | | 0.09 μg/L | | | | |
| Beta Hexachlorocyclohexane (also known as beta HCH) | | 0.16 μg/L | | | | |
| Technical Hexachlorocyclohexane (also known as technical HCH) | | 0.12 μg/L | | | | |
| Hexachlorocyclopentadiene (also known as Endosulfan) | | 74 μg/L | | | | |
| Aldrin | | 0.00074 μg/L (7.4 x10⁻⁴) | | | | |
| Dieldrin | 0.0000065 μg/L (6.5 x10⁻⁶) | 0.00076 μg/L (7.6 x10⁻⁴) | | | | |
| Endrin | | 1.0 μg/L | | | | 2 μg/L |
| Chlordane | 0.00025 μg/L (2.5 x10⁻⁴) | 0.0046 μg/L (4.6 x10⁻³) | | | | 2 μg/L |
| Heptachlor | | 0.0028 μg/L (2.8 x10⁻³) | | | | 0.4 μg/L |
| Toxaphene | 29 μg/L | 0.0071 μg/L (7.1 x10⁻³) | | | | 3 μg/L |
| Polychlorinated Biphenyls (PCBs) |
| Polychlorinated Biphenyls (PCBs), Total (sum of all congeners) | 0.0000068 μg/L (6.8 x10⁻⁶) | 0.00079 μg/L (7.9 x10⁻⁴) | | | | 0.5 μg/L |
| Polycyclic Aromatic Hydrocarbons (PAHs) |
| Polycyclic Aromatic Hydrocarbons (PAHs) (includes seven PAH compounds) | | 0.028 μg/L | | | | |
| Benzo(a)pyrene | | 0.028 μg/L | | | | 0.2 μg/L |
| Fluoranthene | | 42 μg/L | | | | |
| Semi-Volatile Organics (SVOCs) |
| 1,2,4,5-tetrachlorobenzene | | 38 μg/L | | | | |
| 1,2-diphenylhydrazine | | 0.422 μg/L | | | | |
| Dichlorobenzenes (all isomers) | | 400 μg/L | | | | 600 μg/L |
| 1,4-dichlorobenzene | | 400 μg/L | | | | 75 μg/L |
| 2,4,5-trichlorophenol | | 0.422 μg/L | | | | |
| 2,4,6-trichlorophenol | | 12 μg/L | | | | |
| 2,4-dichlorophenol | | 3,090 μg/L | | | | |
| 2,4-dimethylphenol | 450 μg/L | | | | | |
| Dinitrophenol | | 70 μg/L | | | | |
| 2,4-dinitrophenol | 55 μg/L | | | | | |
| 4,6-dinitro-o-cresol | | 13.4 μg/L | | | | |
| 2,4-dinitrotoluene | | 1.1 μg/L | | | | |
| Benzidine | | 0.0012 μg/L (1.2 x10⁻³) | | | | |
| Bis (2-chloroethyl) Ether (also known as Dichloroethyl Ether) | | 0.3 μg/L | | | | |
| Bis (2-chloroisopropyl) Ether | | 34.7 μg/L | | | | |
| Bis (chloromethyl) Ether (also known as BCME) | | 0.000038 μg/L (3.8 x10⁻⁵) | | | | |
| Dichlorobenzenes (sum of all isomers) | | 400 μg/L | | | | |
| Dichlorobenzidine | | 0.1 μg/L | | | | |
| Diethyl Phthalate | | 350,000 μg/L | | | | |
| Dimethyl Phthalate | | 313,000 μg/L | | | | |
| Dibutyl Phthalate | | 34,000 μg/L | | | | |
| Di-2-ethylhexyl Phthalate | | 15,000 μg/L | | | | |
| Hexachlorobenzene | 0.00045 μg/L (4.5 x10⁻⁴) | 0.0072 μg/L (7.2 x10⁻³) | | | | 1 μg/L |
| Hexachlorocyclopentadiene | | 206 μg/L | | | | 50 μg/L |
| Hexachloroethane | 5.3 μg/L | 19 μg/L | | | | |
| Isophorone | | 5,200 μg/L | | | | |
| N-nitrosodibutylamine | | 0.064 μg/L | | | | |
| N-nitrosodiethylamine | | 0.008 μg/L | | | | |
| N-nitrosodimethylamine | | 0.014 μg/L | | | | |
| N-nitrosodiphenylamine | | 49 μg/L | | | | |
| N-nitrosopyrrolidine | | 0.16 μg/L | | | | |
| Pentachlorobenzene | | 74 μg/L | | | | |
| Phenol | | 3,500 μg/L | | | | |
| Volatile Organics |
| 1,1-dichloroethylene | | 0.33 μg/L | | | | 7 μg/L |
| 1,1,1-trichloroethane | | 18,400 μg/L | | | | 200 μg/L |
| 1,1,2-trichloroethane | | 6.0 μg/L | | | | 5 μg/L |
| 1,1,2,2-tetrachloroethane | | 1.7 μg/L | | | | |
| 1,2 -dichloroethane | | 9.4 μg/L | | | | 5 μg/L |
| 2,3,7,8-tetrachlorodibenzo-P- Dioxin (also known as 2,3,7,8-TCDD or Dioxin) | 0.0000000086 μg/L (8.6 x10⁻⁹) | 0.0000001 μg/L (1.0 x10⁻⁷) | | | | 0.00000003 μg/L (3.0 x 10⁻⁵) |
| Dichloropropenes (all congeners) | | 87 μg/L | | | | |
| Acrolein | | 320 μg/L | | | | |
| Acrylonitrile | | 0.58 μg/L | | | | |
| Benzene | 12 μg/L | 6.6 μg/L | | | | 5 μg/L |
| Nitrobenzene | | 19,800 μg/L | | | | |
| Chlorobenzene (also known as Monochlorobenzene) | 470 μg/L | 488 μg/L | | | | 100 μg/L |
| Carbon Tetrachloride | | 4.0 μg/L | | | | 5 μg/L |
| Chloroform | | 1.9 μg/L | | | | |
| Ethylbenzene | | 1,400 μg/L | | | | 700 μg/L |
| Hexachlorobutadiene | | 4.47 μg/L | | | | |
| Methylene Chloride (also known as Dichloromethane) | 47 μg/L | | | | | 5 μg/L |
| Tetrachloroethylene | | 8 μg/L | | | | 5 μg/L |
| Toluene | 5,600 μg/L | 14,300 μg/L | | | | 1,000 μg/L |
| Trichloroethylene (also known as Trichloroethene) | 29 μg/L | 27 μg/L | | | | 5 μg/L |
| Vinyl Chloride | | 20 μg/L | | | | 2 μg/L |
| Halomethanes (all compounds) | | 1.9 μg/L | | | | |
*Indicates a treatment technique (TT) action Level as opposed to MCL.
APPENDIX 2
IDEM's Total Maximum Daily Load
Program Priority Framework and Development Schedule
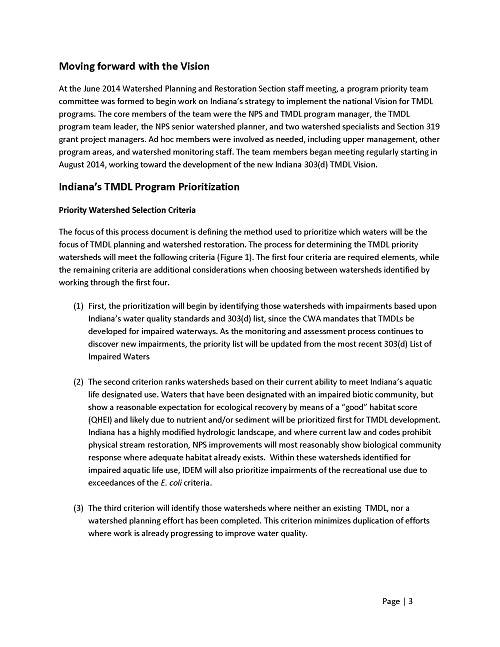
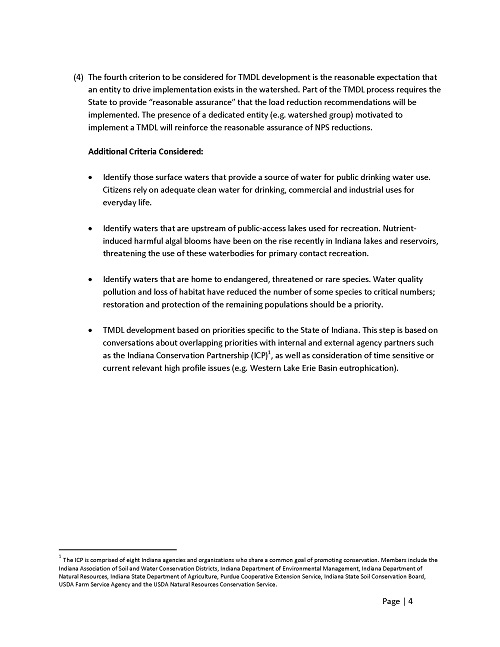
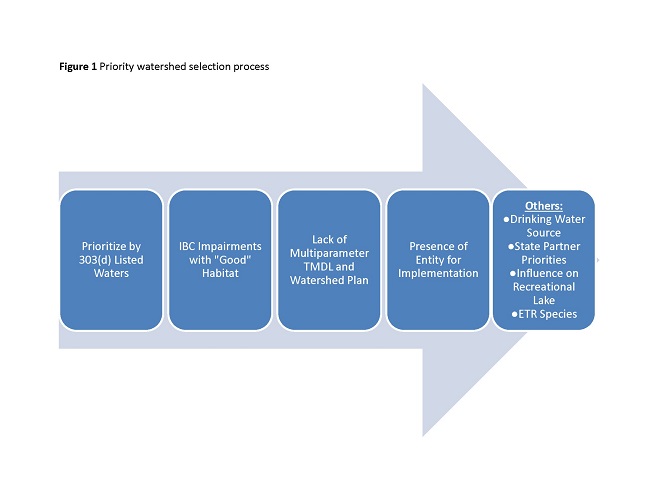
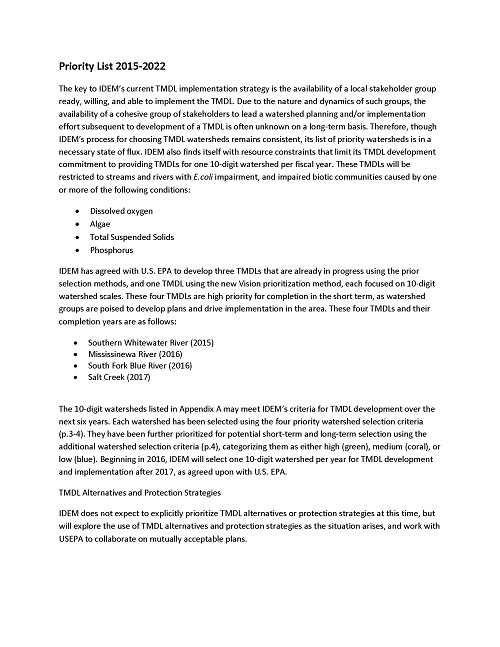
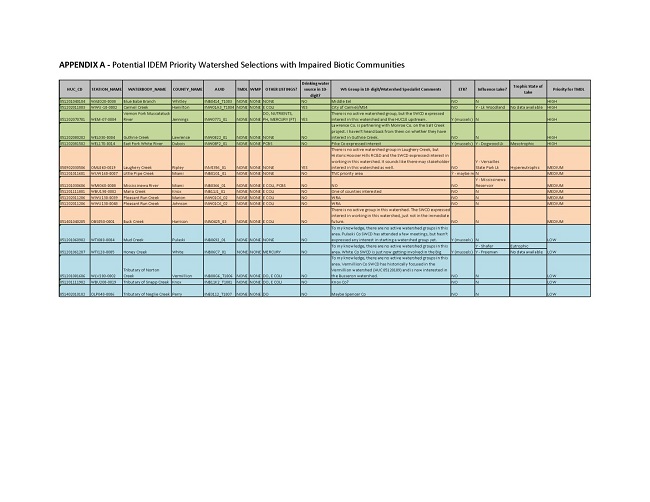
1 Fish consumption is not a designated use in Indiana's WQS. IDEM assesses Indiana waters for fish consumption pursuant to current U.S. EPA policy and in keeping with CWA goals, which are reflected in Indiana's WQS (
327 IAC 2-1-1.5 and
327 IAC 2-1.5-3).
2 The designation for public water supply use is applicable only to waters that serve as a routine or emergency source of water for a public water system.
3 The NHD is a database created by U.S. EPA and the United States Geological Survey that provides a comprehensive coverage of hydrographic data for the United States. It uniquely identifies and interconnects the stream segments that comprise the nation's surface water drainage system and contains information for other common surface waterbodies such as lakes, reservoirs, estuaries, and coastlines.
4 Stream order is a measure of the relative size of streams. Streams sizes range from the smallest "first-order" stream (for example, a small creek) to the largest or "twelfth-order" stream (for example, the Amazon River).
5 The NHD is a database created by the U.S. EPA and the United States Geological Survey that provides a comprehensive coverage of hydrographic data for the United States. It uniquely identifies and interconnects the stream segments that comprise the nation's surface water drainage system and contains information for other common surface waterbodies such as lakes, reservoirs, estuaries, and coastlines.
6 Dissolved oxygen and temperature results are also evaluated for exceedance(s) of the applicable criteria. However, these results are not used to make impairment decisions because the data are not considered representative of conditions throughout each pool or over the entire assessment period.
7 Relevant sections of the Indiana's water quality standards include
327 IAC 2-1.5-8(e)(3)(b) for waters within the Great Lakes basin and
327 IAC 2-1-6(d)(3), which applies to downstate waters.
8 Dissolved oxygen and temperature results are also evaluated for exceedance(s) of the applicable criteria. However, these results are not used to make impairment decisions because the data are not considered representative of conditions throughout each pool or over the entire assessment period.
9 For Indiana waters within the Great Lakes Basin, acute aquatic criteria refer to the "criterion maximum concentration" (CMC) identified in
327 IAC 2-1.5, and the chronic aquatic criteria refer to the "criterion continuous concentration" (CCC), also described therein. For downstate waters (those located outside of the Great Lakes Basin) the acute aquatic criteria refer to the "AAC" values shown in
327 IAC 2-1 and the chronic aquatic criteria are shown as the "CAC" values.
10 The value of 576 cfu/100mL comes from U.S. EPA's Ambient Water Quality Criteria for Bacteria - 1986 (U.S. EPA, 1986) and represents the single sample maximum applicable to waters infrequently used for full body recreation. For data collected from bathing beaches, the single day maximum value of 235 cfu/100mL is applied.
11 IDEM considers any existing and readily available data received for the purposes of determining use support. Most assessments are based on data collected during the period of record, which is the period of time in which the data are considered reliable for the purposes of assessment. The period of record varies based on the type of assessment and data being evaluated but always includes the most recent data available. Older data collected prior to the period of record is considered supplementary and can often provide additional insights into current water quality conditions.
12 "Active" intakes are those that are currently in use. "Inactive" intakes are those that were previously in service but taken offline by the treatment facility and which are unlikely to ever be reactivated.
13 In its Great Lakes Monitoring and Research Strategy, U.S. EPA defines the boundary between offshore and nearshore areas as the depth contour equal to the mean depth of the lake. The nearshore area consists of water adjacent to the shoreline and not more than 85 meters in depth, and the offshore is the remaining portion of the lake (U.S. EPA, 1992).
14 The criteria identified in Table 6-1 are applicable to waters outside the Great Lakes basin and can be found in
327 IAC 2-1-6. The criteria identified in Table 8-3 apply to waters located within the Great Lakes basin and can be found in
327 IAC 2-1.5-8.
15 For all waters in the Great Lakes basin, these substances and criteria are defined in
327 IAC 2-1.5-8(f). For all other Indiana waters, these substances and criteria are defined in
327 IAC 2-1-6(e).
16 For waters in the Great Lakes basin, these substances and criteria are defined in
327 IAC 2-1.5-8(f). For all other Indiana waters, these substances and criteria are defined in
327 IAC 2-1-6(e).
18 See http://in.gov/idem/cleanwater/2494.htm for more detailed information regarding Level 1 and Level 2 Assessments under the RTCR.
19 Personal communication with Stacy Jones, Technical Environmental Specialist for IDEM OWQ's Drinking Water Branch (January 15, 2016).
21 Fish consumption is not a designated use in Indiana's WQS. IDEM assesses Indiana waters for fish consumption pursuant to current U.S. EPA policy and in keeping with CWA goals, which are reflected in Indiana's WQS (
327 IAC 2-1-1.5 and
327 IAC 2-1.5-3).
22 Applicable only to waters that serve as a source of water for a public water system.
23 A decision to list a water in Category 4B using 40 CFR Part130.7(b)(1)(i) must be supported by the issuance of technology-based effluent limitations required by Sections 301(b), 306, 307, or other sections of the CWA. A decision to list in Category 4B using 40 CFR Part 130.7(b)(1)(ii) must be supported by the issuance of more stringent effluent limitations required by federal, state, or local authority. The U.S. EPA expects that the state will provide a rationale for why it believes that these effluent limits will achieve WQS within a reasonable period of time. Placement of waters in Category 4B based on 40 CFR Part 130.7(b)(iii) must be supported by the existence of "other pollution control requirements (for example, best management practices) required by local, state, or federal authority" that are stringent enough to implement WQS. EPA expects that the state will demonstrate that these control requirements will achieve WQS within a reasonable period of time.
Posted: 01/29/2020 by Legislative Services Agency
DIN: 20200129-IR-318200006ONA
Composed: Apr 24,2024 7:55:17PM EDT
A
PDF version of this document.